Create a Replication
An XDCR replication allows data to be replicated continuously from a specified bucket on the source cluster to a specified bucket on the target.
Understanding Replications
An XDCR replication is created on the cluster that is to be the source of the data-replication. Each replication uses a single reference, which has already been created. (See Create a Reference.) To create the replication, you specify:
-
The local, source bucket from which data is to be replicated; and, potentially, the scopes and collections within that bucket.
-
The remote cluster to which data is to be replicated. This cluster must already be registered on the local cluster as a reference.
-
The bucket on the remote cluster to which data is to be replicated; and, potentially, the scopes and collections within that bucket.
-
Whether filtering should be used in replication, and if so, according to what regular expression.
-
Other Advanced Replication Settings, which can be used to optimize replication-performance.
Note that multiple replications (each using a different source-target bucket combination) can be created using a single reference (which refers to a target cluster, but not to any specific bucket on it).
Examples on This Page
The examples in the subsections below show how to create the same replication; using the UI, the CLI, and the REST API respectively. As their starting-point, the examples assume the scenario that concluded the page Create a Reference, this being:
-
Two clusters already exist; each containing a single node. These are named after their IP addresses:
10.144.210.101and10.144.210.102. -
Each cluster contains a single bucket, which is the
travel-samplebucket. -
Each cluster has the Full Administrator username of
Administrator, and password ofpassword. -
Cluster
10.144.210.101now has a reference that specifies its owntravel-samplebucket as a source, and thetravel-samplebucket on10.144.210.102as a target.
Create an XDCR Replication with the UI
Proceed as follows:
-
Access Couchbase Web Console. Left-click on the XDCR tab, in the left-hand navigation menu.
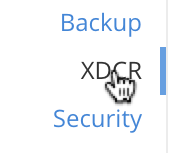
This displays the XDCR Replications screen, which lists the following:
-
Remote Clusters: Lists the remote clusters that have been registered as references on the current cluster.
-
Outgoing Replications: Lists the details of replications created on the current cluster.
-
Incoming Replications: Lists the details of replications created on the remote clusters, which are incoming to the current cluster.
If the remote cluster is the same as the current cluster, the replications are not listed in the Incoming Replications section. For information about incoming replications, see Incoming Replications. 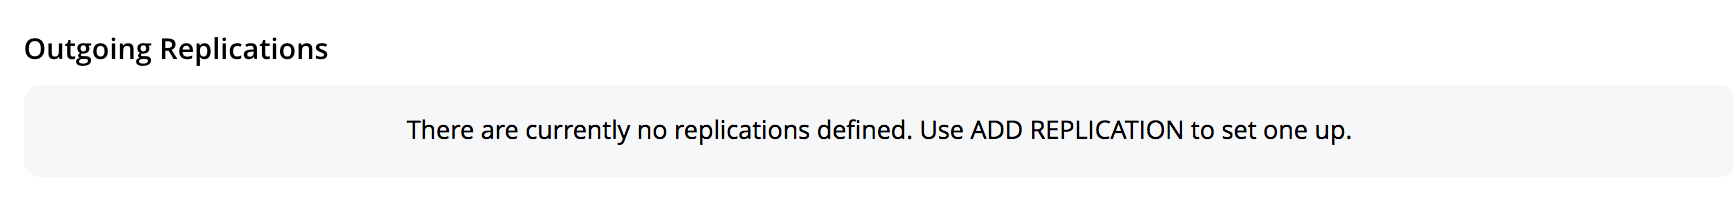
-
-
To start creating a replication, left-click on the ADD REPLICATION button:

The XDCR Add Replication screen is now displayed:
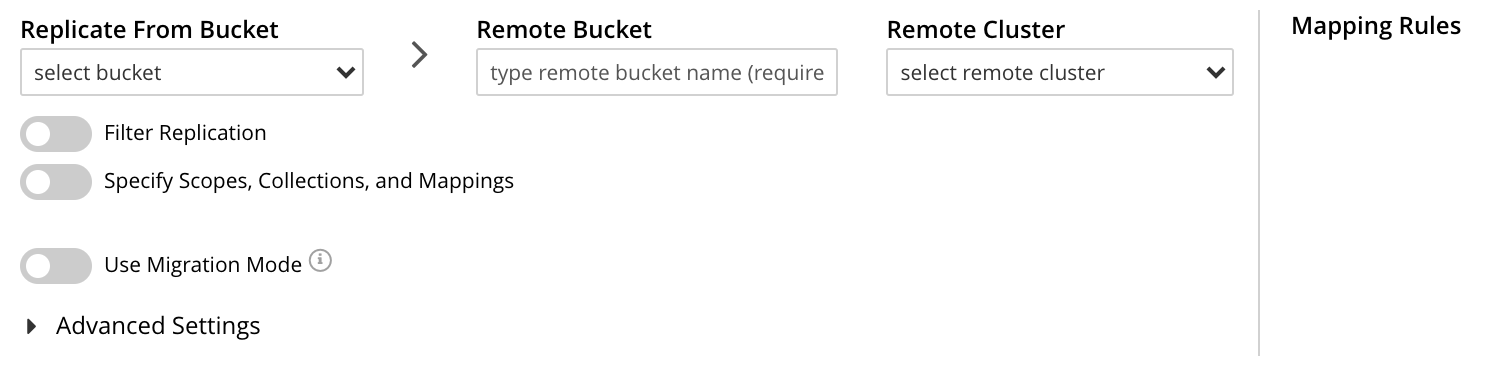
The fields in the upper area of the screen — Replicate From Bucket, Remote Bucket, and Remote Cluster — allow a replication to be defined that specifies source and target bucket only. The remaining fields allow scopes and collections — within source and/or target buckets — to be additionally specified; and allow Advanced Settings to be used.
The example on this page will not configure Advanced Settings; and will specify source and target bucket only — each bucket being specified as the sample bucket
travel-sample.Note that since the data within
travel-sampleis contained within multiple scopes and collections, the path to each collection — known as a keyspace, and always being of the formscope-name.collection-name— is necessarily identical on each cluster. XDCR’s default behavior is always to replicate data between corresponding keyspaces: for example, data ininventory.airlineon the source is replicated toinventory.airlineon the target. When a keyspace on the source does not have a corresponding keyspace on the target, XDCR’s default behavior is not to replicate data from that source keyspace. This is known as replication by implicit mapping.Detailed examples of explicitly specifying scopes and collections (and so, potentially, establishing mappings between dissimilar keyspaces) are provided later, in Replicate Using Scopes and Collections.
Note that when a replication is defined only as bucket to bucket (as in the current example), and thereby makes no reference to a scope or collection, the documents to be replicated are understood by XDCR to reside in the
_defaultcollection, which resides within the_defaultscope, of the source bucket. The documents will duly be replicated to the_defaultcollection, in the_defaultscope, of the target bucket. For more information , see Default Scope and Collection.An account of Advanced Settings is provided in Advanced Replication Settings with the UI, below.
The practical steps required for establishing filters are explained in Filter a Replication.
Information about Replication Settings for XDCR Conflict Logging is provided in a later section.
-
Enter appropriate information into the upper fields of the Add Replication screen. Specify
10.144.210.102as the target cluster, andtravel-sampleas both source and target bucket. The fields in the upper area of the screen now appear as follows.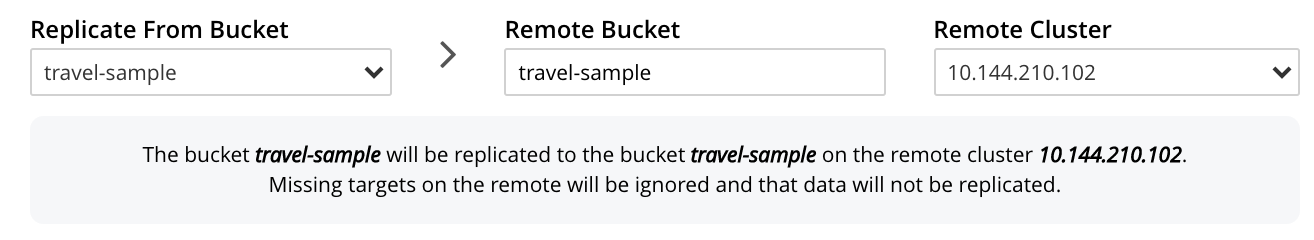
-
Left-click on the Save Replication button, at the bottom of the screen:

The XDCR Replications screen is now redisplayed, with the appearance of the Outgoing Replications panel as follows:
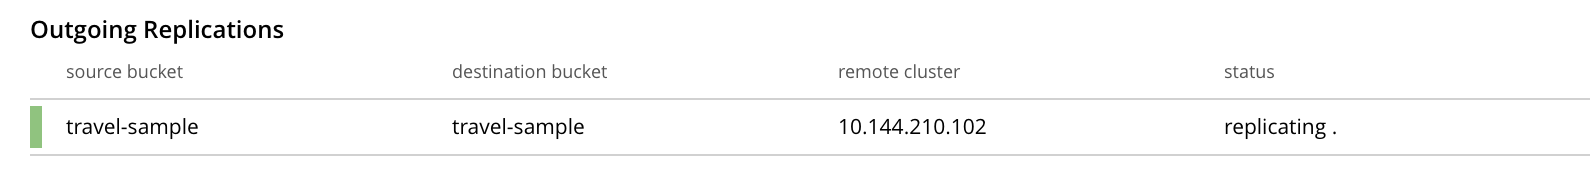
This indicates that a replication is now in progress: from
travel-sampleon this cluster, totravel-sampleon cluster10.144.210.102.
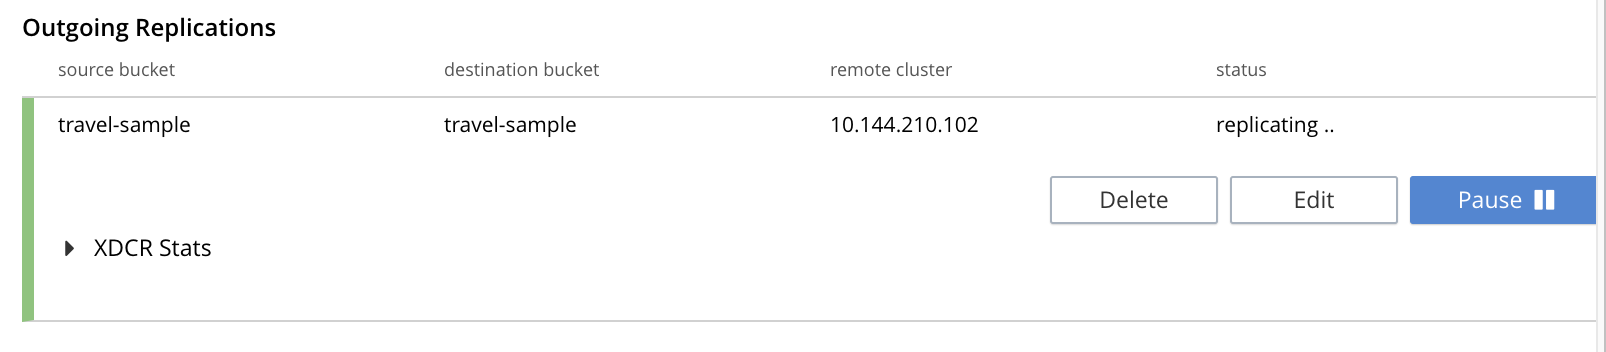
This concludes creation of the replication. Note that by left-clicking on the row for the replication, additional controls can be displayed:
When conflict logging is enabled, Outgoing Replications panel displays the Conflict Logging Rules panel, which shows the conflict collection mapping that you have chosen. Also, the bucket indicates Conflict Logging Enabled.

Use of the Pause control is described in Pause a Replication; use of the Delete control in Delete a Replication; and use of the Edit control in Editing Filters.
Monitor Current Replications
All current replications can be monitored, by left-clicking on the XDCR Stats tab, at the left of the XDCR Replications screen. The panel appears as follows.
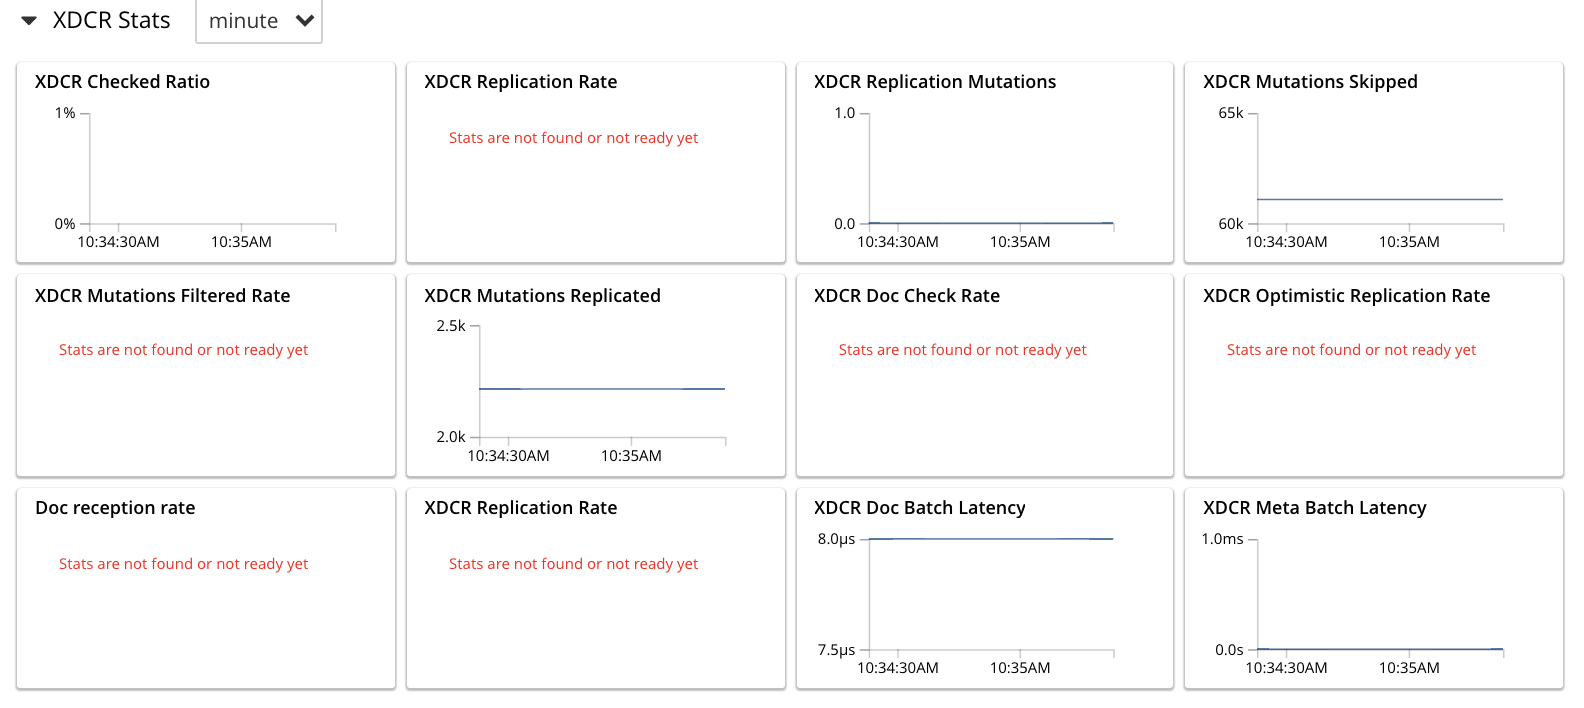
For information on how to read the interactive charts now displayed, see Manage Statistics.
Advanced Replication Settings with the UI
Left-click on the Advanced Replication Settings control, in the Add Replication dialog. The UI expands vertically, to reveal the following:
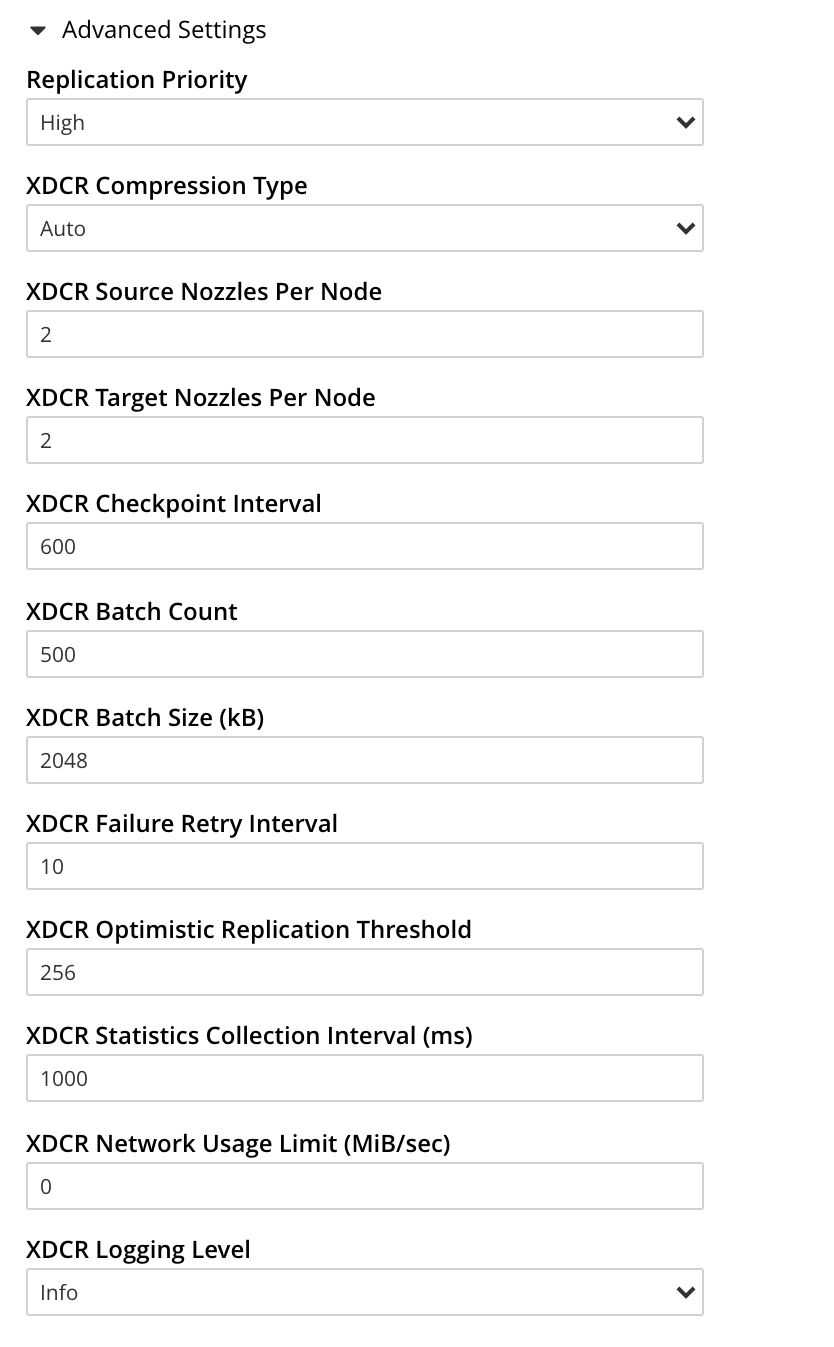
The values displayed in the fields are defaults, which can be modified interactively, and saved: this may help in achieving optimal replication-performance. For details on the significance of each field, see the XDCR Reference.
Replication Settings for XDCR Conflict Logging
The XDCR Add Replication page displays additional settings, which are specific to logging conflicts during an XDCR replication.
To configure and enable XDCR Conflict Logging, you must enable the bucket property enableCrossClusterVersioning on all buckets of the XDCR topology.
This bucket property cannot be disabled once it is enabled.
For more information about the bucket property enableCrossClusterVersioning, see XDCR enableCrossClusterVersioning.
|
The additional settings are as follows:
- Specify collections for storing conflict logs and documents
-
Use this setting to enable choosing conflict collections for storing conflict logs and documents. This setting allows you to specify the bucket, scope, and collection where conflict logs and documents will be stored during XDCR conflict logging process. Conflict Logging Rules panel displays the mapping of conflict collections that you have specified.
- Enable Conflict Logging
-
Use this setting to enable or disable conflict logging for the replication. When enabled, XDCR starts logging conflicts in the specified bucket, scope, and collection.
- Default Conflict Log Collection
-
Use this setting to specify the default bucket, scope, and collection for conflict logging. If a custom collection is not specified, the default collection is used.
By default, conflicts are logged in the bucket, scope, and collection of the Default Conflict Log Collection. Use Customise Conflict Logging at scope level and Customise Conflict Logging at collection level to override the default settings. - Customise Conflict Logging at scope level
-
Use this setting to specify the scope for a custom conflict collection.

- Customise Conflict Logging at collection level
-
Use this setting to specify a custom collection to store conflict logs. You can choose a custom conflict collection that overrides the default conflict collection. Choose one of the following collection types:
-
Default collection: To set the collection to the default collection of the bucket.
-
Parent collection: To set the collection to that of the scope.
-
Custom collection: To set the collection to a custom collection that you specify.
-
Do not log: To disable conflict logging for this collection.

-
For more information, see Enabling and Configuring Conflict Logging.
For more information about XDCR Conflict Logging, see XDCR Conflict Logging.
For more information about creating collections, see Manage Scopes and Collections.
Error Notifications
If, while a replication is in progress, errors occur, a notification appears adjacent to the status displayed on the row for the replication:
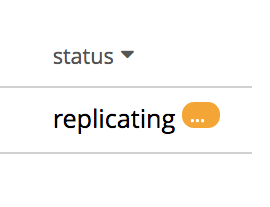
Left-click on the orange icon, to display a full account of problems:
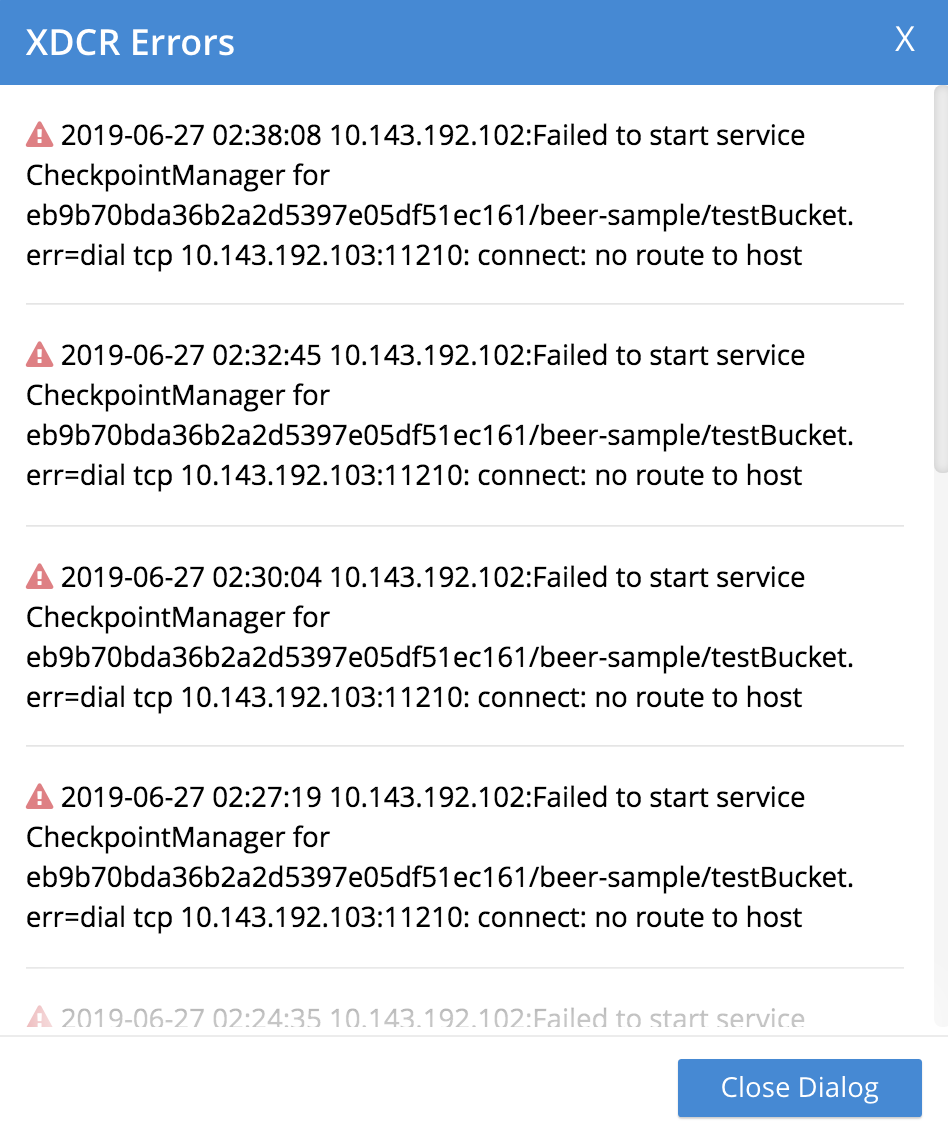
Note that in this window, in Couchbase-Server versions 7.1 and later, a message such as the following may appear:
Performing PeerToPeer communication with the following VBs:[…].
This message may appear when XDCR is communicating with nodes during replication-startup, when cluster topology-changes are occurring, and possibly in other situations: the message is purely informational, and does not signify an error.
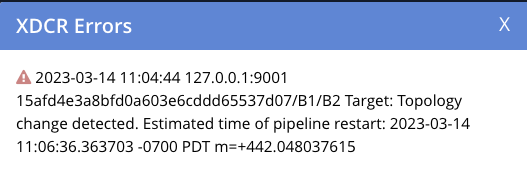
Rebalance Information
XDCR provides information on cluster-rebalance status. An error message may be displayed, to indicate that the rate of replication has been affected; and to provide an estimated time of pipeline-restart. The error message may convey status on a rebalance occurring either on the target side:
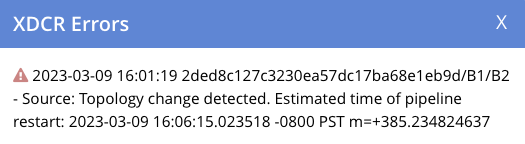
Or on the source side:
Create an XDCR Replication with the CLI
Staring from the scenario defined above, in Examples on This Page, use the CLI xdcr-replicate command to create an XDCR replication, as follows:
couchbase-cli xdcr-replicate -c 10.144.210.101 \
-u Administrator \
-p password \
--create \
--xdcr-cluster-name 10.144.210.102 \
--xdcr-from-bucket travel-sample \
--xdcr-to-bucket travel-sample \
--xdcr-replication-mode xmem
If successful, this provides the following response:
SUCCESS: XDCR replication created
For more information, see the complete reference for the xdcr-replicate command. Note that this includes descriptions of all flags that support the Advanced Settings, described above.
Create an XDCR Replication with the REST API
Starting from the scenario defined above, in Examples on This Page, using the REST API’s POST /controller/createReplication HTTP method and URI, create an XDCR reference as follows:
curl -v -X POST -u Administrator:password \
http://10.144.210.101:8091/controller/createReplication \
-d fromBucket=travel-sample \
-d toCluster=10.144.210.102 \
-d toBucket=travel-sample \
-d replicationType=continuous \
-d enableCompression=1
If successful, this provides the following response:
{"id":"82026f90f5f573b5e50ec8b7a7012ab1/travel-sample/travel-sample"}
For more information, see Creating a Replication. For information on REST-driven configuration of the Advanced Settings described above, see Managing Advanced Settings.
Create an XDCR Replication with mobile=Active
To create or update an XDCR replication with mobile=Active, do one of the following:
-
Create an XDCR replication with
mobile=Activeor update an existing replication. For information about creating (new) an XDCR replication withmobile=Active, see Greenfield deployment, and for information about updating an existing replication withmobile=Active, see Upgrade an existing setup. -
Create or update an XDCR replication with
mobile=Activeoption using the REST API, starting from Server 7.6.6 version. See Creating a Replication. -
Create or update a XDCR replication with
mobile=Activeoption from the UI, starting from Server 7.6.6 version. See Create an XDCR Replication with the UI.
The pre-requisite to use mobile=Active is to set the bucket property enableCrossClusterVersioning. For more information about the bucket property enableCrossClusterVersioning, see XDCR enableCrossClusterVersioning.
To enable the bucket property enableCrossClusterVersioning using REST API, see Modify the bucket property enableCrossClusterVersioning or Example: Turning on enableCrossClusterVersioning, when Editing.
Next Steps
Once a replication has been defined and is therefore running, you can opt to pause it, in order to perform system maintenance. See Pause a Replication.