Debugging and diagnostics in the Eventing Service comprises of debugging functions, functions log, and log redaction.
Debugging Functions
Couchbase Server, for its Eventing Service framework, includes a powerful full function online real-time JavaScript Debugger. Debug is a special flag on a Function. The Debug option integrates seamlessly with the Google Chrome Debugger engine for running the JavaScript code of any Eventing Function.
The default Eventing debug port is 9140. To change the default port settings, see Modifying the Debug Port.
Debugging Workflow
-
During a debug session, a single mutation received by the Eventing Function is taken from the primary processing stream(s) and sent to the Debugger. This technique ensures that processing of the other data mutations in the cluster does not stall or get blocked.
-
When a worker thread traps the next event-instance for debugging, it opens an ephemeral TCP port, and generates a Chrome dev-tools URL, with a session cookie that controls the debug worker.
-
The Chrome dev-tools URL must be hand copied due to built-in security in the browser.
-
All other events processed by the Eventing Function are unaffected except for the single the trapped event-instance.
-
Using the Debug option, you can place breakpoints in the code and run the Function execution, step through your code one line at a time, and inspect values of your variables. The step-step execution helps while troubleshooting the deployed Eventing Function under real world constraints.
-
If the debugged event-instance completes execution, no further event-instances get trapped for debugging. If you wish to debug a second event-instance you need to stop and restart the debugger in the Function’s code editor.
-
If a debug session gets terminated during execution, then the mutation may be abruptly processed or canceled.
-
Debugging is a convenience-feature intended to help during Function development: it is highly discouraged for use in production environments.
Debug mode should be avoided in production environments, as it affects the in-order processing of the document mutations as well as introducing timing related issues.
Enable Debugging of Eventing Functions
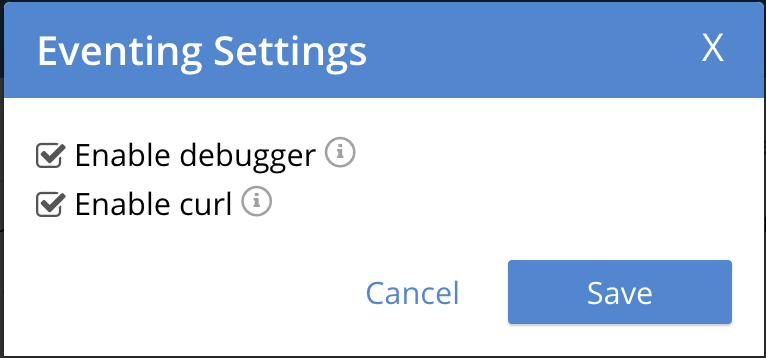
The debugger should only be enabled when you plan to debug your functions. When done with interactive debugging you should disable the option to increase security. This setting change is needed to enable the Debug button in the View JavaScript code editor for a deployed Function.
-
To enable debugging for the Eventing Service, navigate to Couchbase Web Console > Eventing page
-
Click *SETTINGS" in the top banner.
-
In the "Eventing Settings" Dialog check the *Enable debugger" checkbox.
-
Click "Save
Debugging a Function
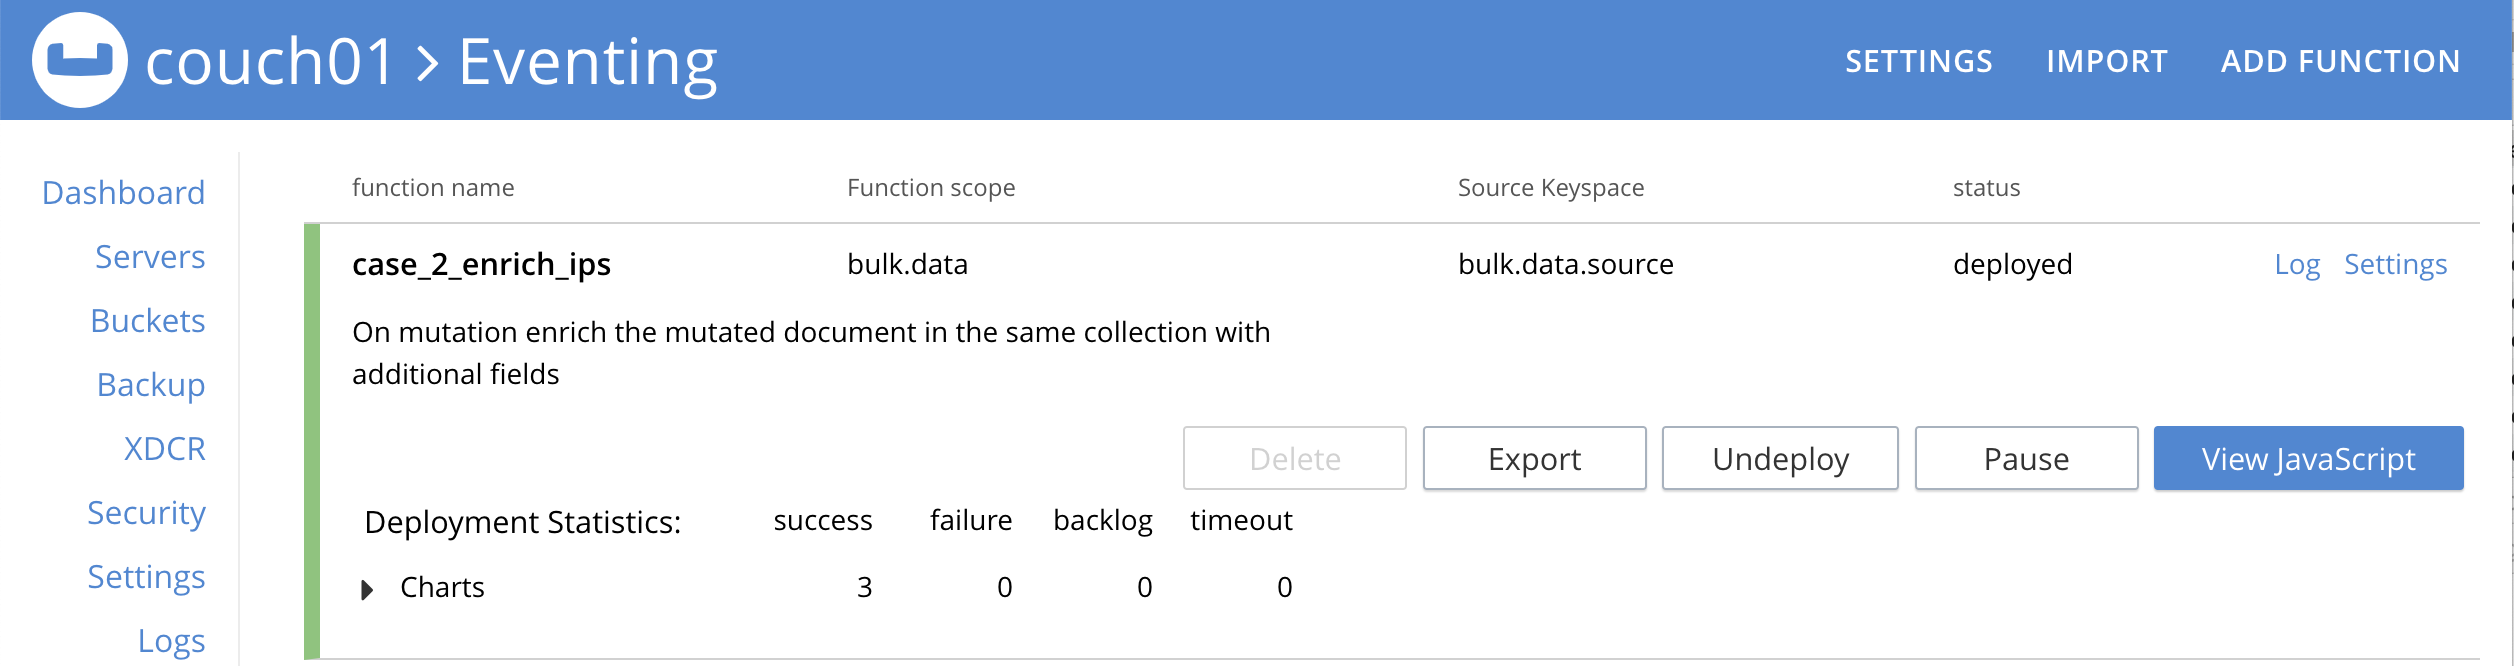
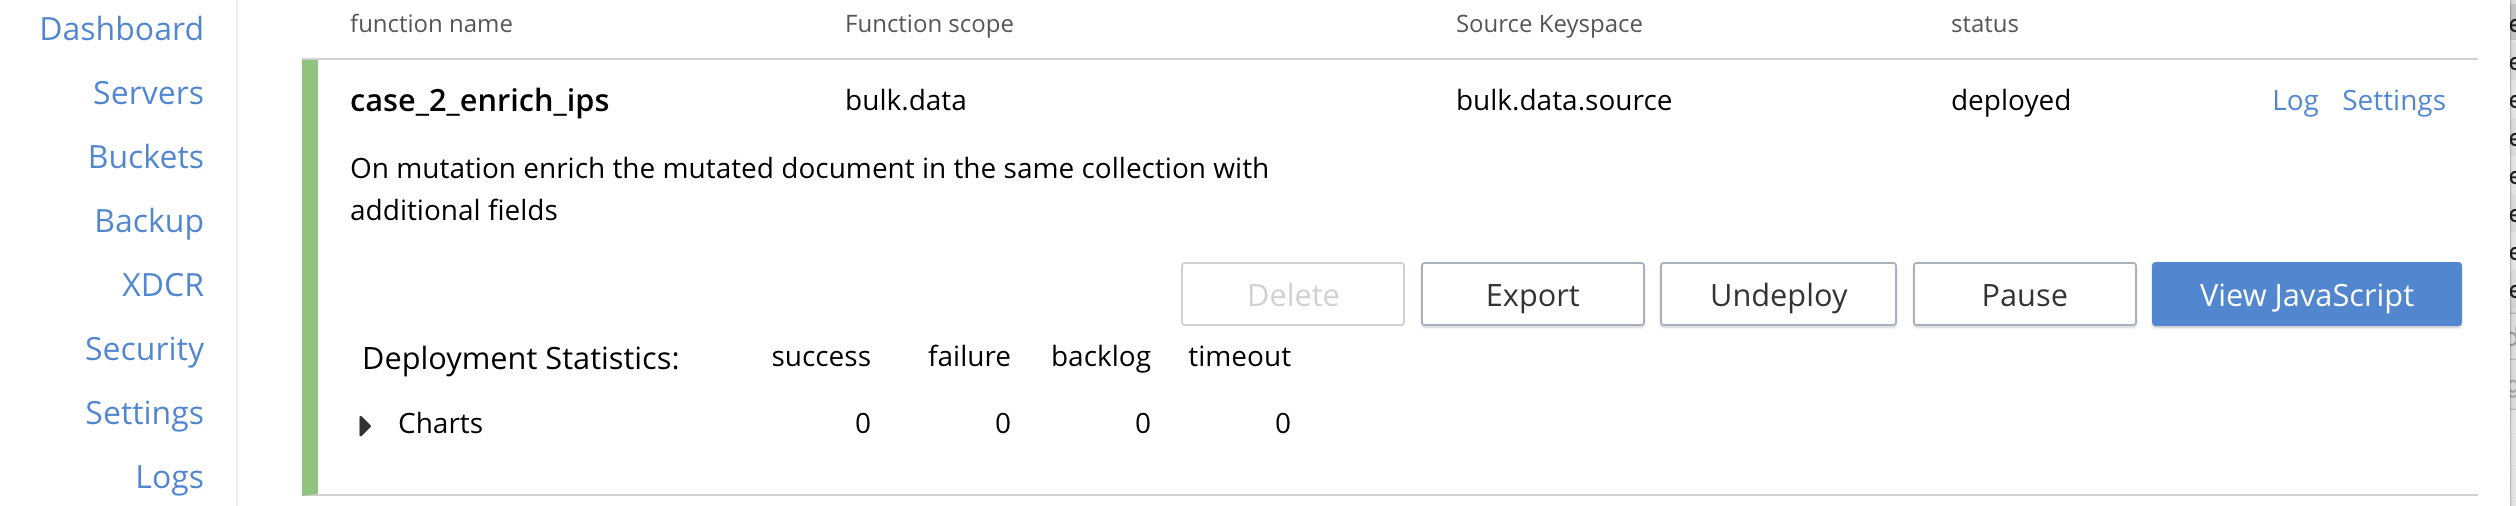
Below we have expanded the deployed Eventing Function "case_2_enrich_ips" from the Example Data Enrichment.
-
The deployed Function expands (when you click the Function’s name) to provide additional options:
-
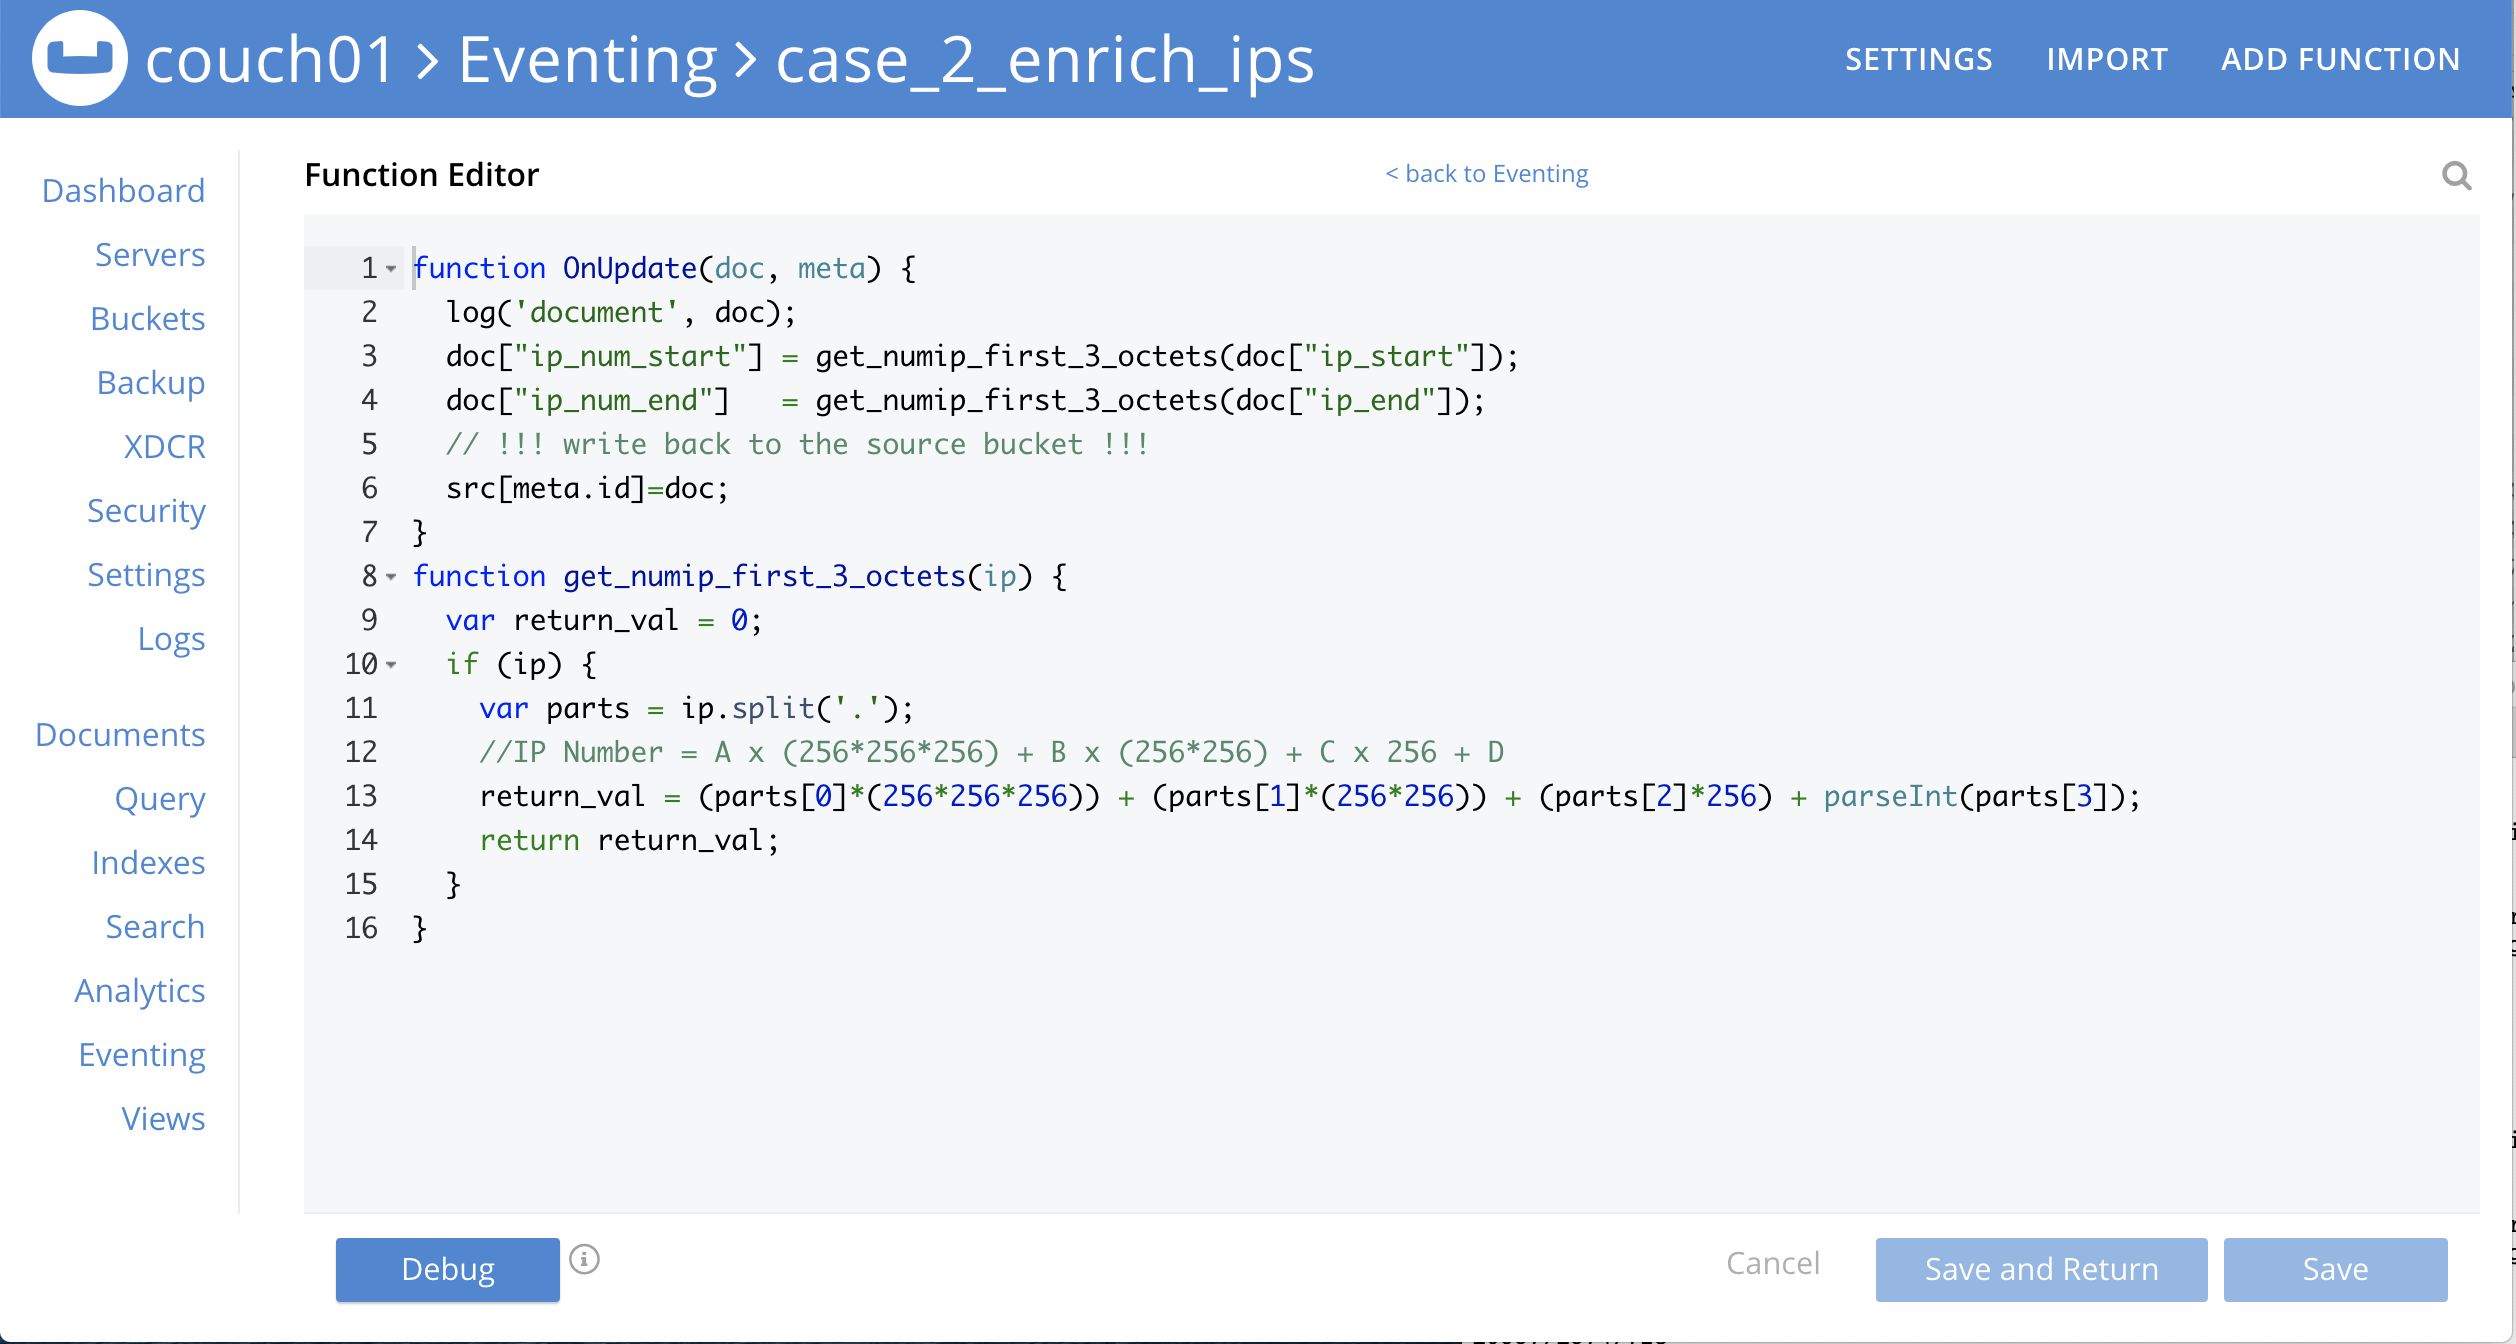
Click View JavaScript to bring up the Function’s JavaScript
-
Because we enabled debugging we now have a button, Debug, in the lower left of the code editor
-
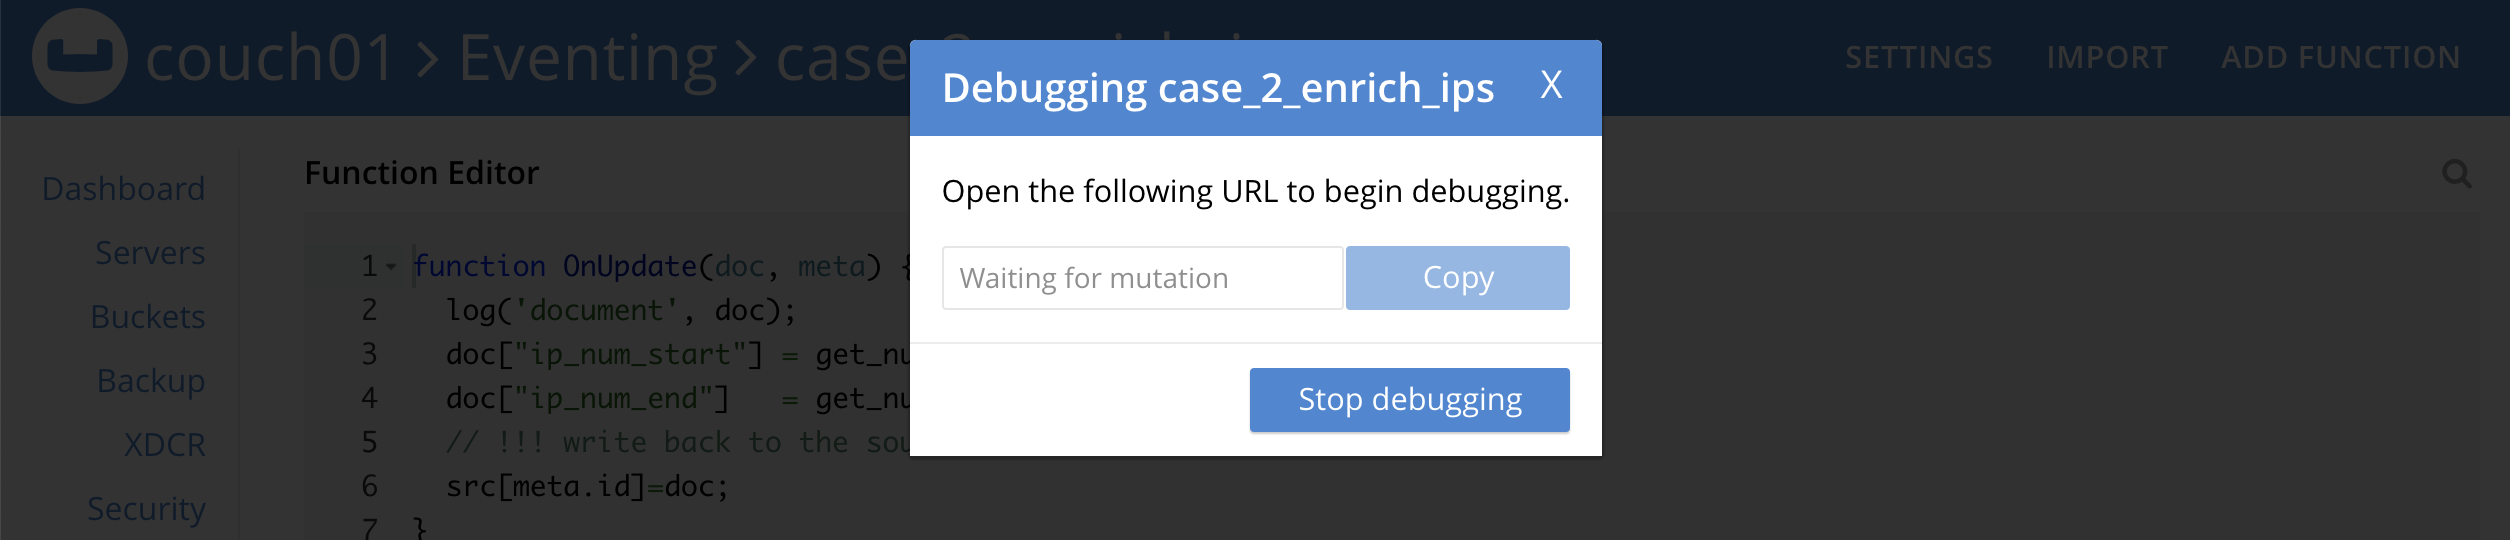
From the View JavaScript page, click Debug. This will activate a one-time debug session. As a result, the next event-instance will get trapped and is forwarded to the Debugger.
-
In the above screen, you can notice the message: "Waiting for mutation."
During a debugging session this window must remain active. When you are presented a debug URL you must copy then paste it into a new browser window (described below). If you are using the UI to create the mutation, you must use a different browser tab/window to create the mutation. -
Since we are using an Example we need to trigger a mutation in another tab/window, *do not close this browser tab/window with your debugging dialog*.
If you are debugging an Eventing Function that has a constant stream of mutations you would not need to make your own mutation.
-
In tab/another window access the Couchbase Web Console > Buckets page and click the Scopes and Collections link of the bulk bucket.
-
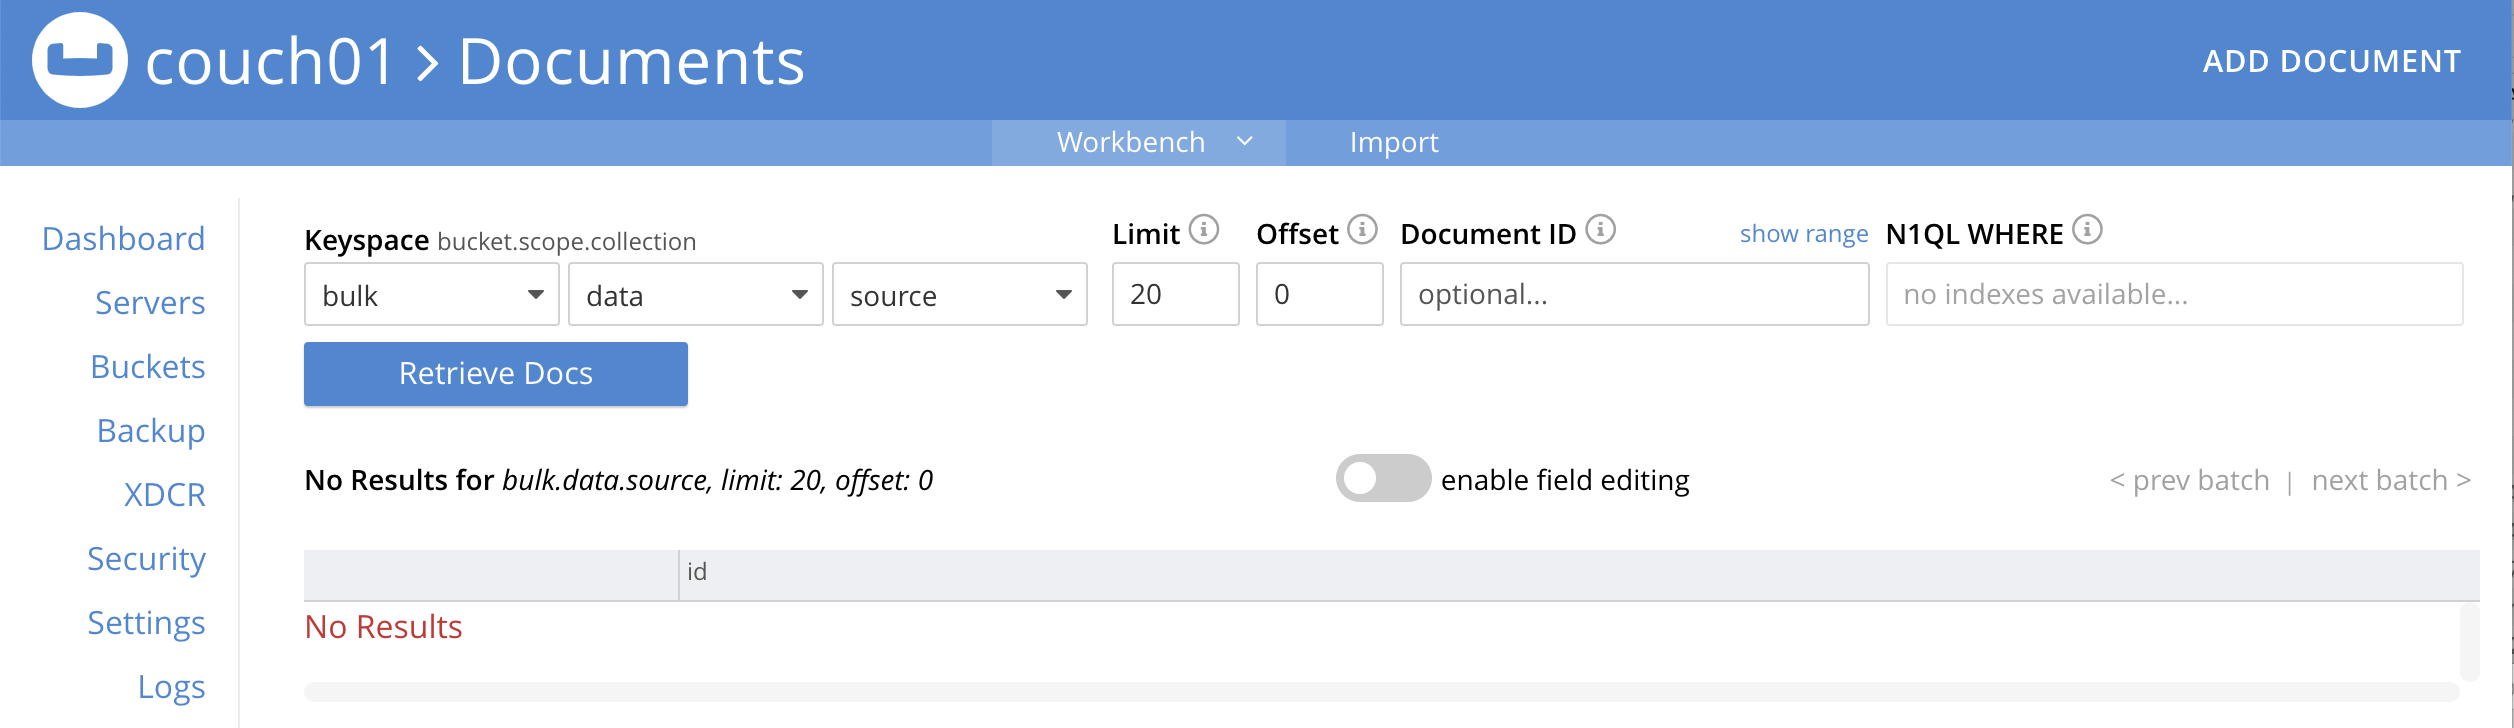
Click Documents in the upper right banner for the data scope.
-
Select the keyspace bulk, data, source
-
You should see no user records (for this example).
-
Click Add Document in the upper right banner
-
For the ID in the Create New Document dialog specify SampleDocument
ID [ SampleDocument ]
-
For the document body in the Create New Document dialog, the following text is displayed:
{ "click": "to edit", "with JSON": "there are no reserved field names" } -
replace the above text with the following JSON document via a cut-n-paste
{
"country": "AD",
  "ip_start": "5.62.60.1",
  "ip_end": "5.62.60.9"
}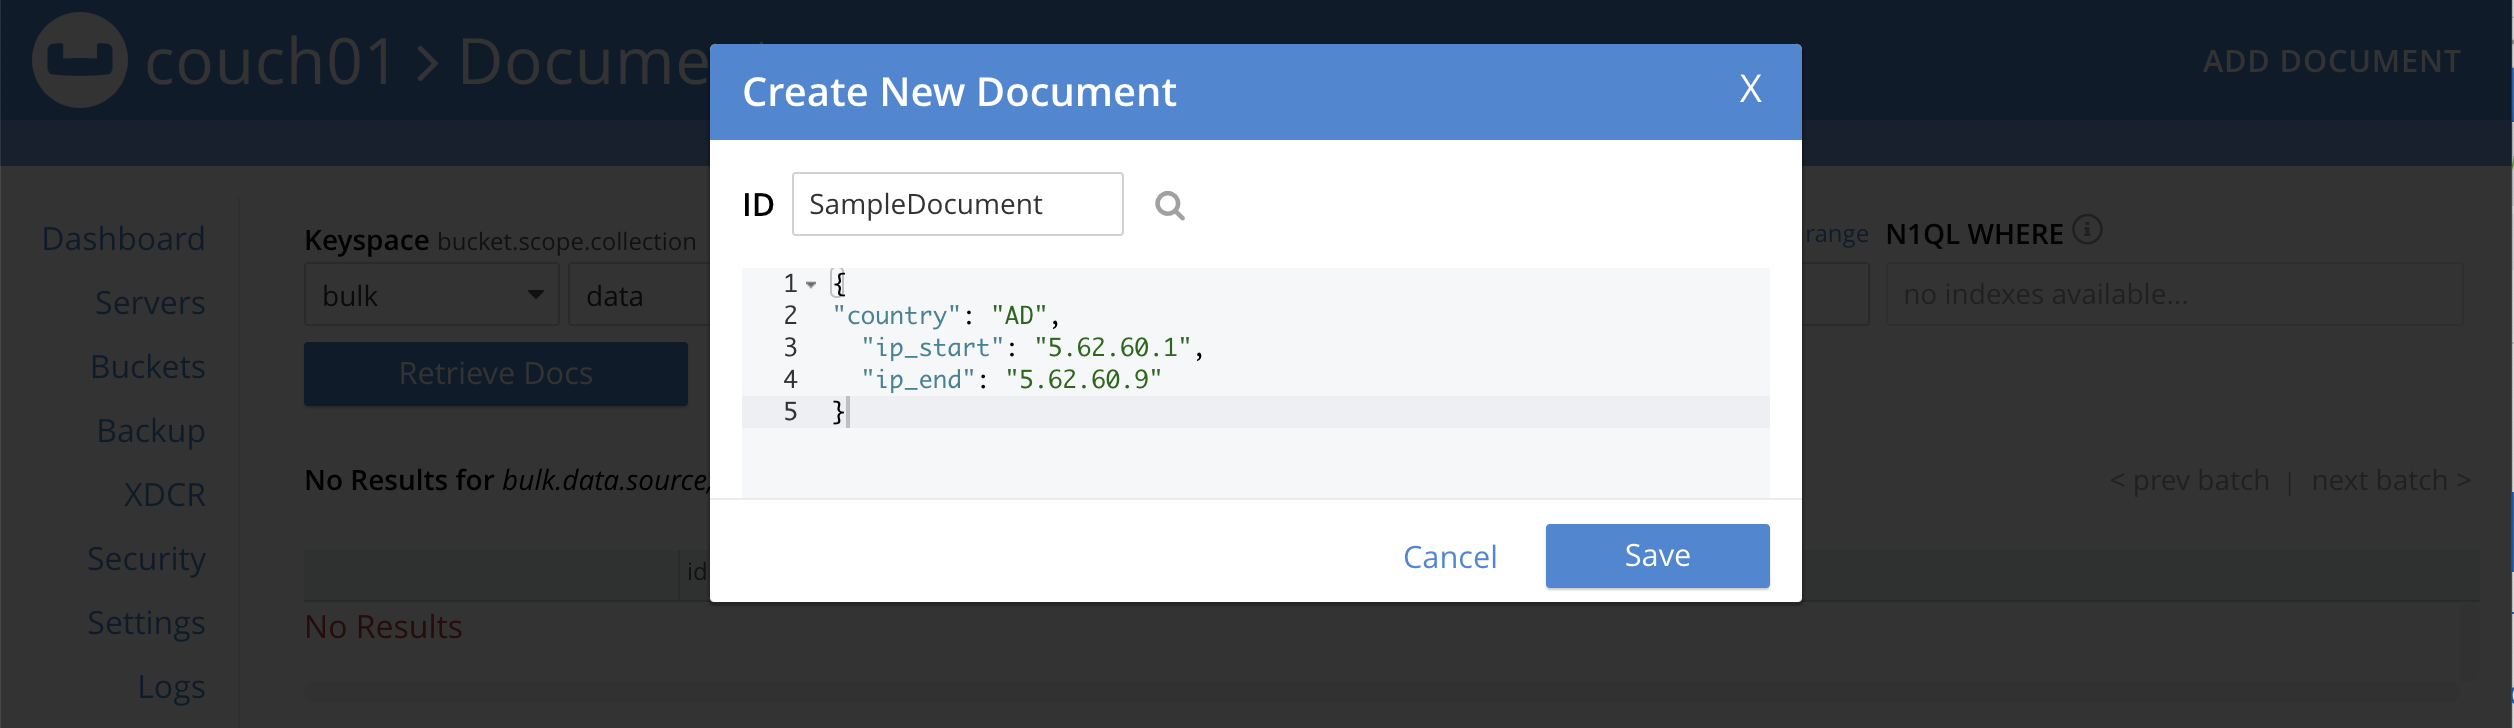
-
Click Save to generate a mutation in your Eventing Function’s "Listen to Location".
-
-
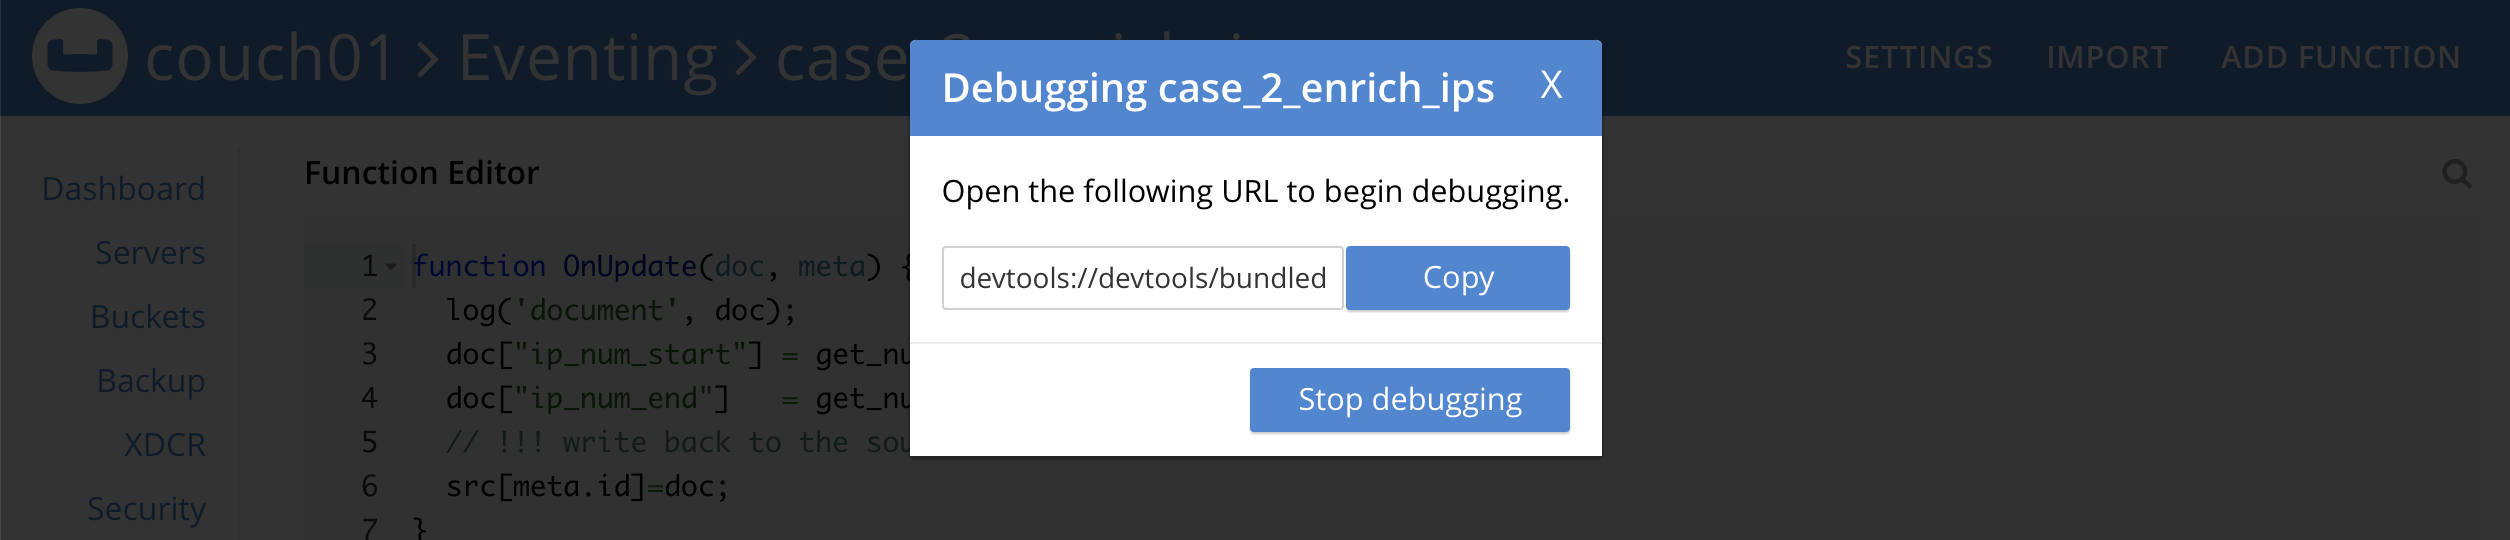
Return to the tab/window that was in "Waiting for mutation." state. You can see the one-time debugging URL is now filled in and available to copy.
-
In the above debugging dialog Click COPY
-
Open a new tab/window, *do not close this browser tab/window with your debugging dialog*, for the Google Chrome Debugging session.
-
Paste the copied one-time debugging URL into the address bar and hit return.
-
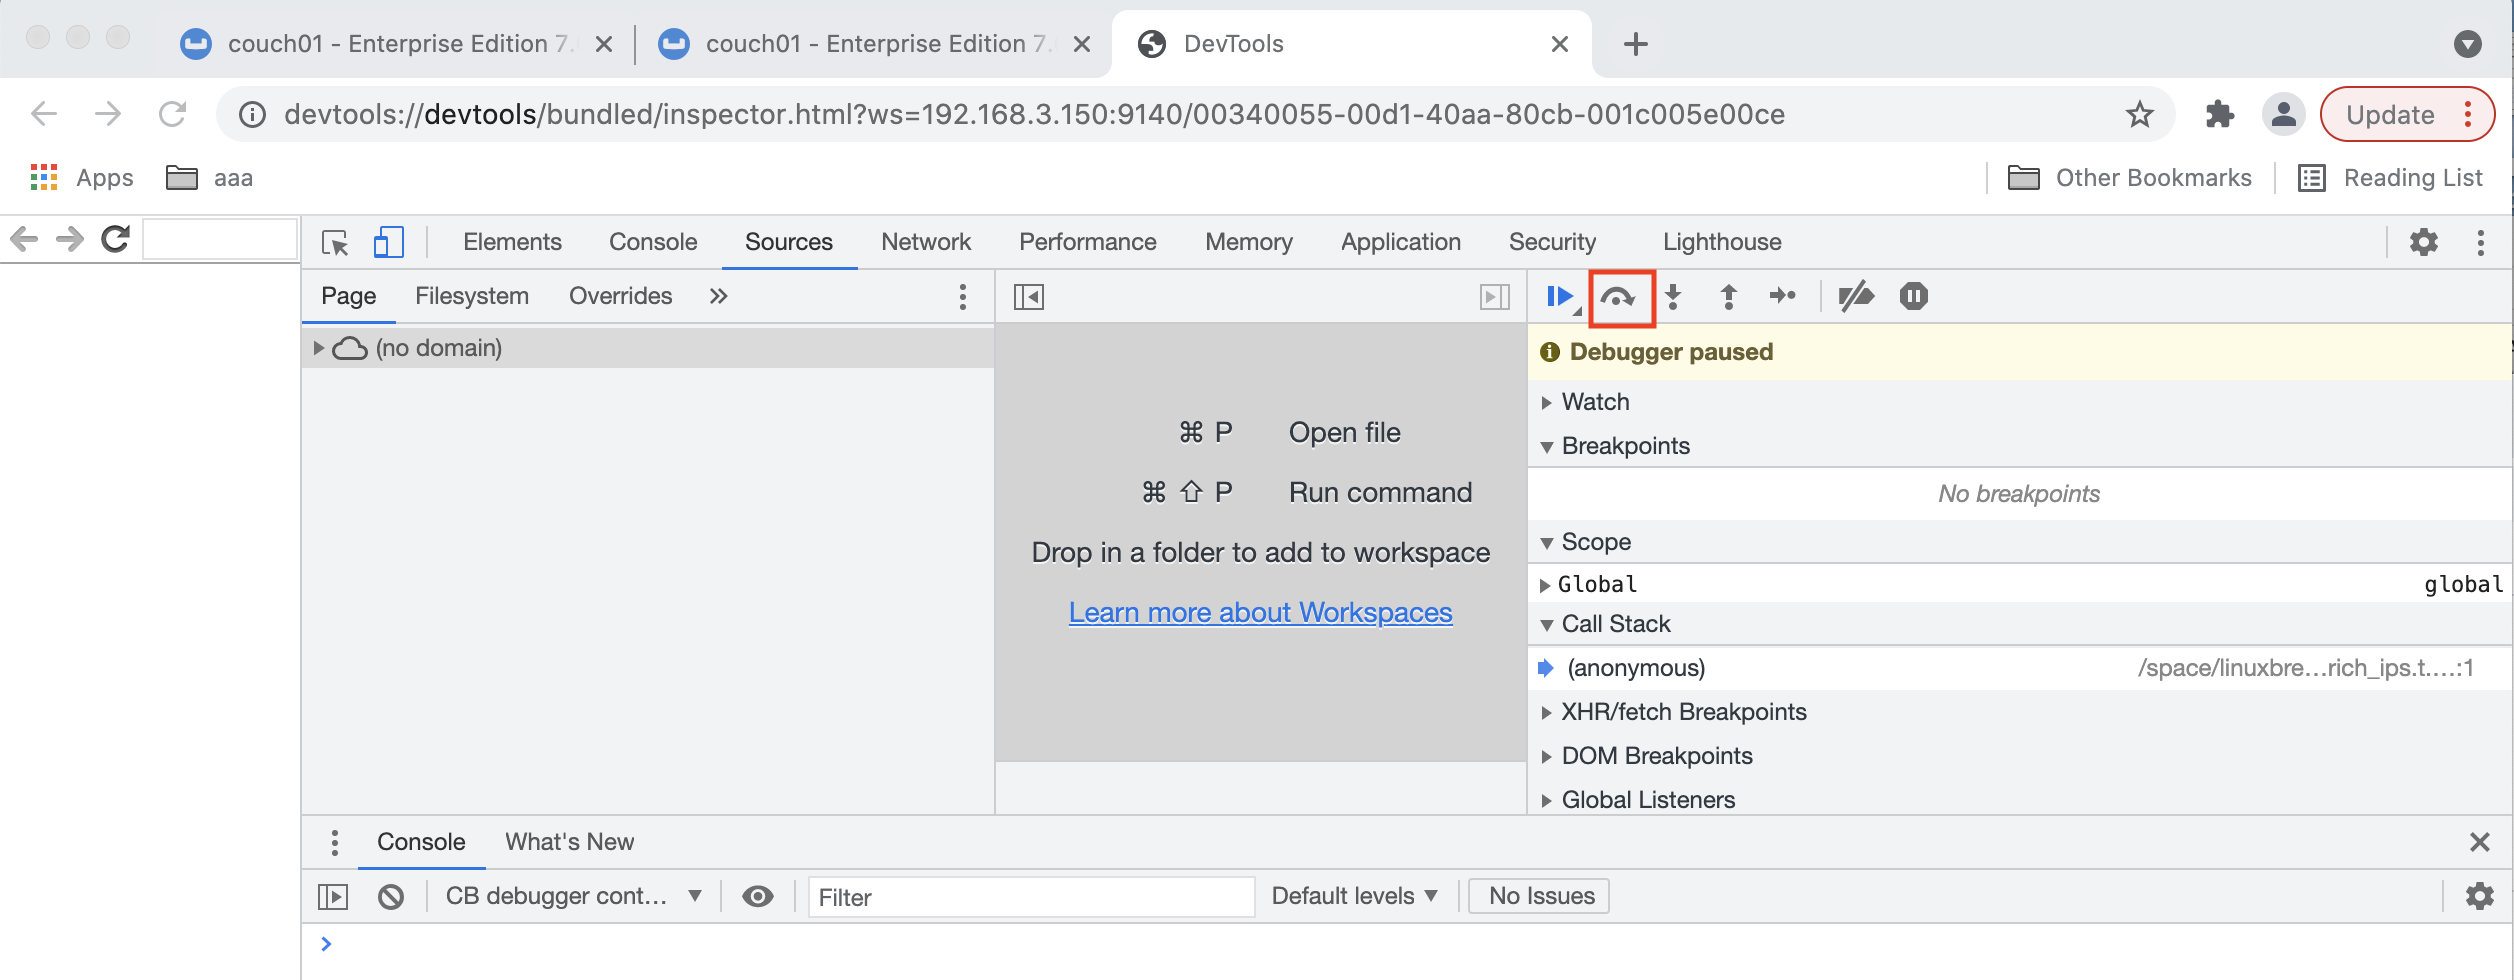
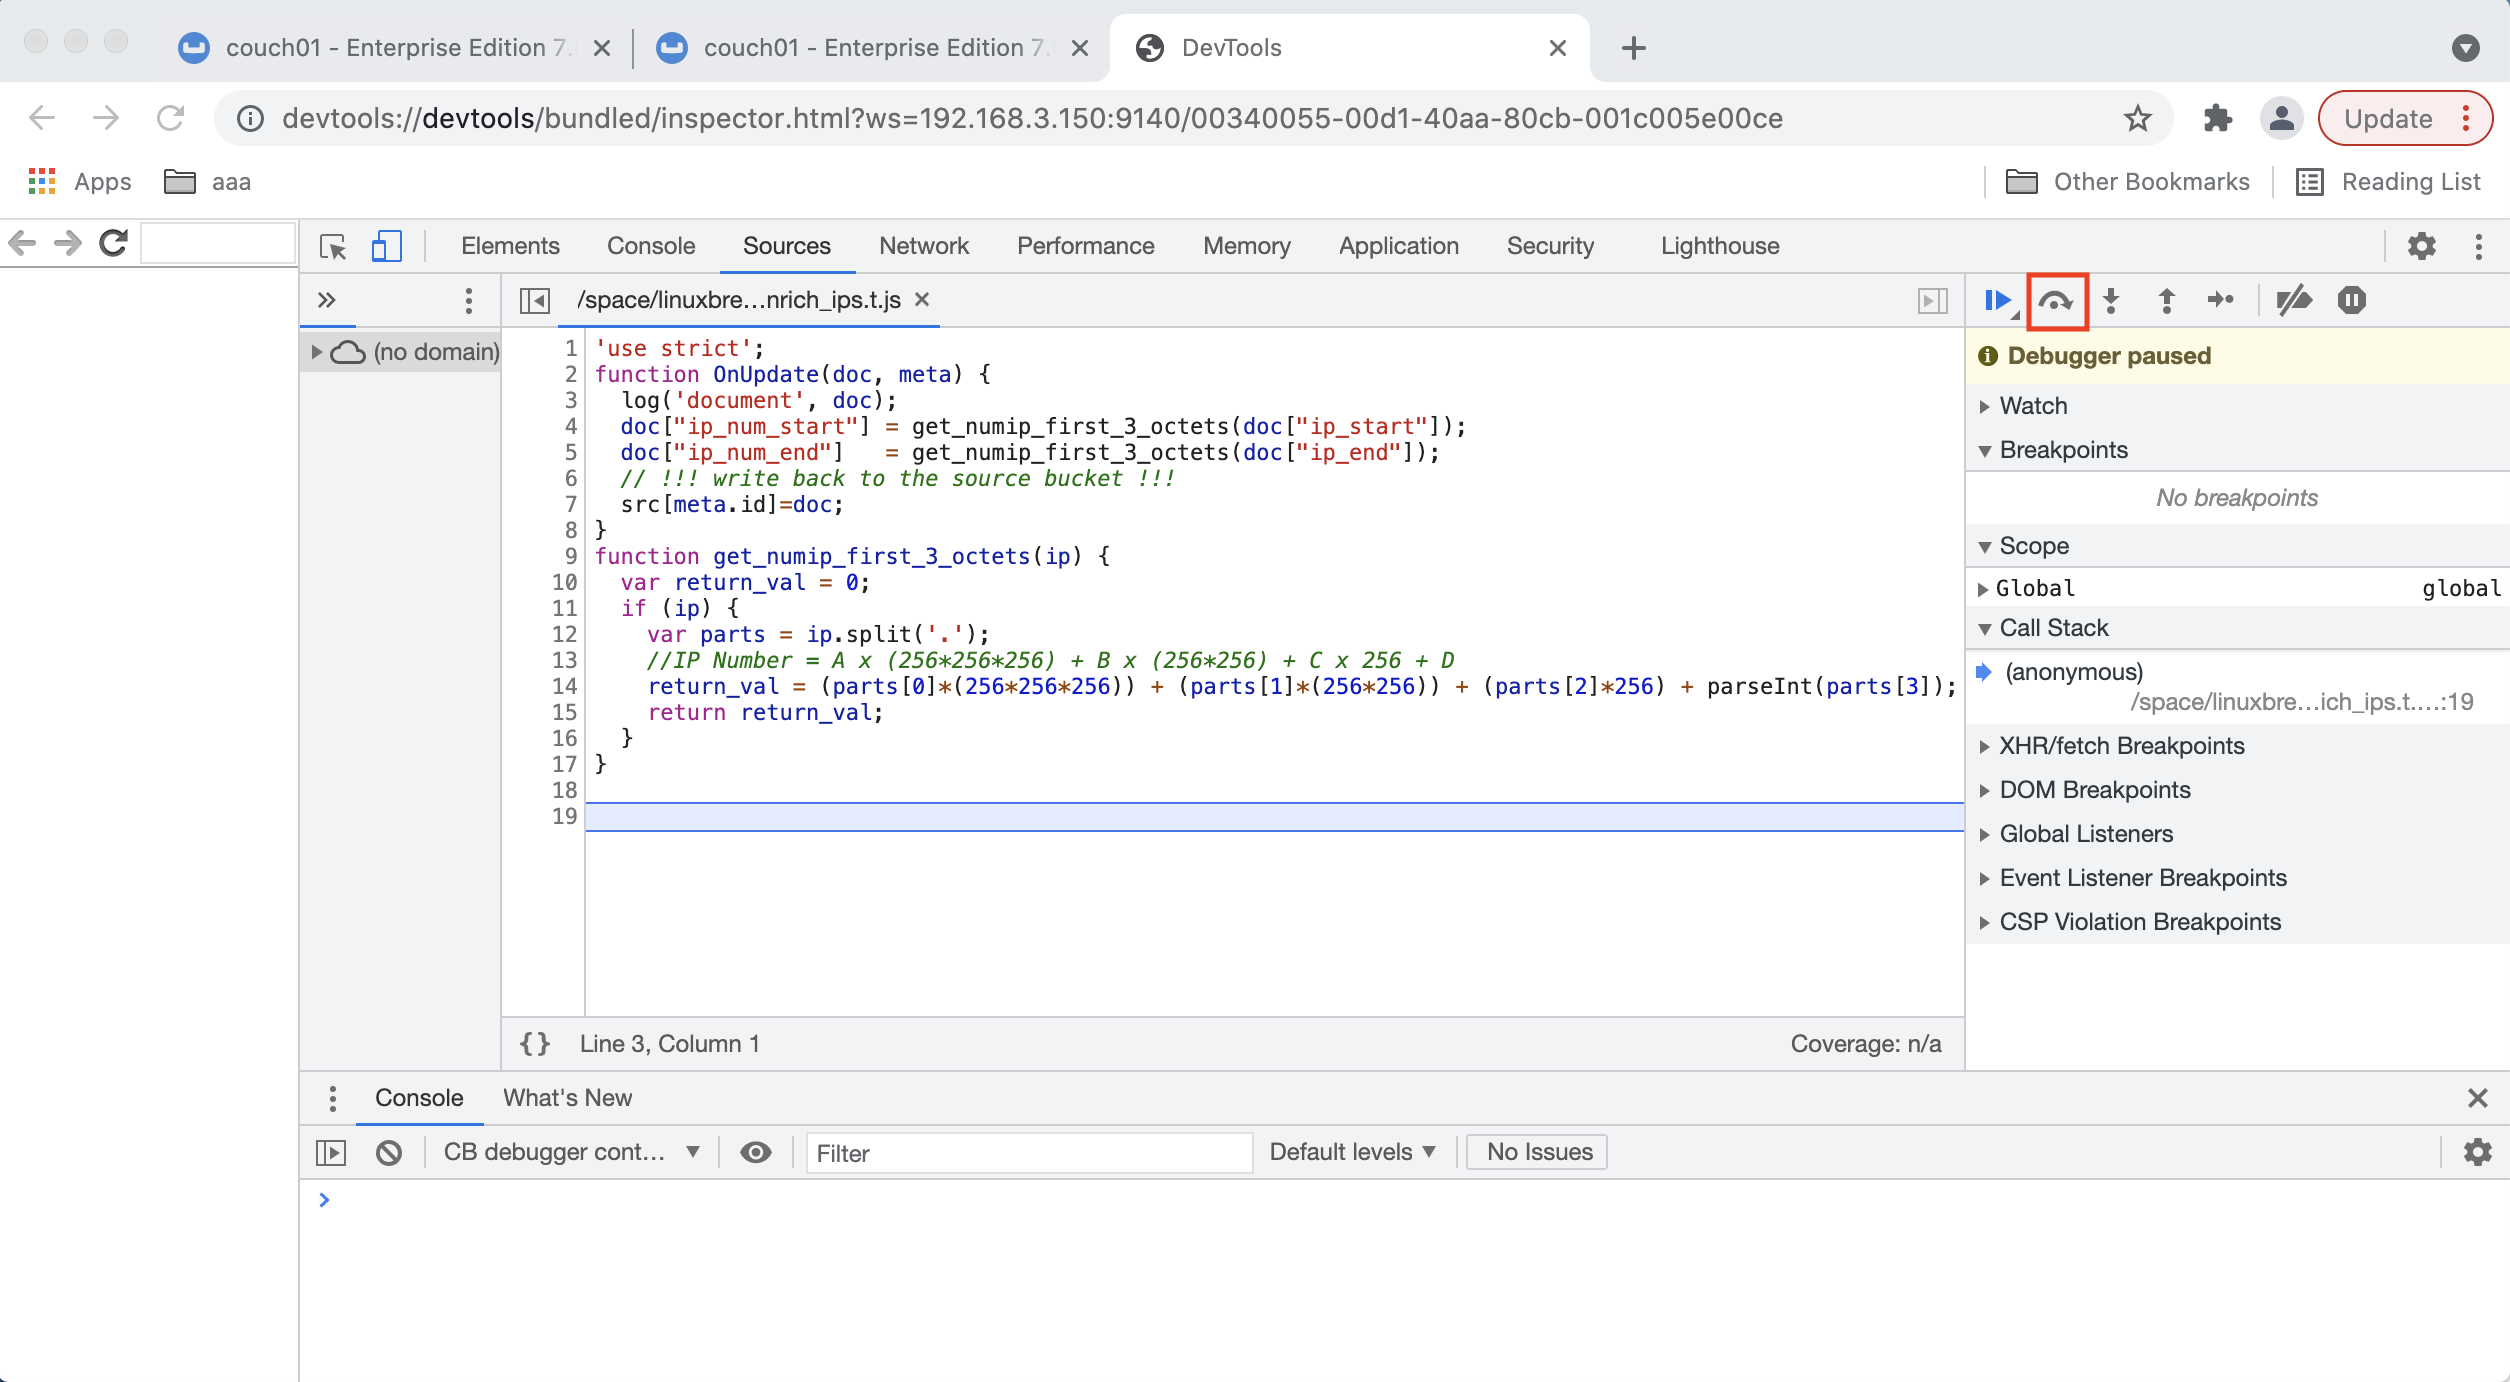
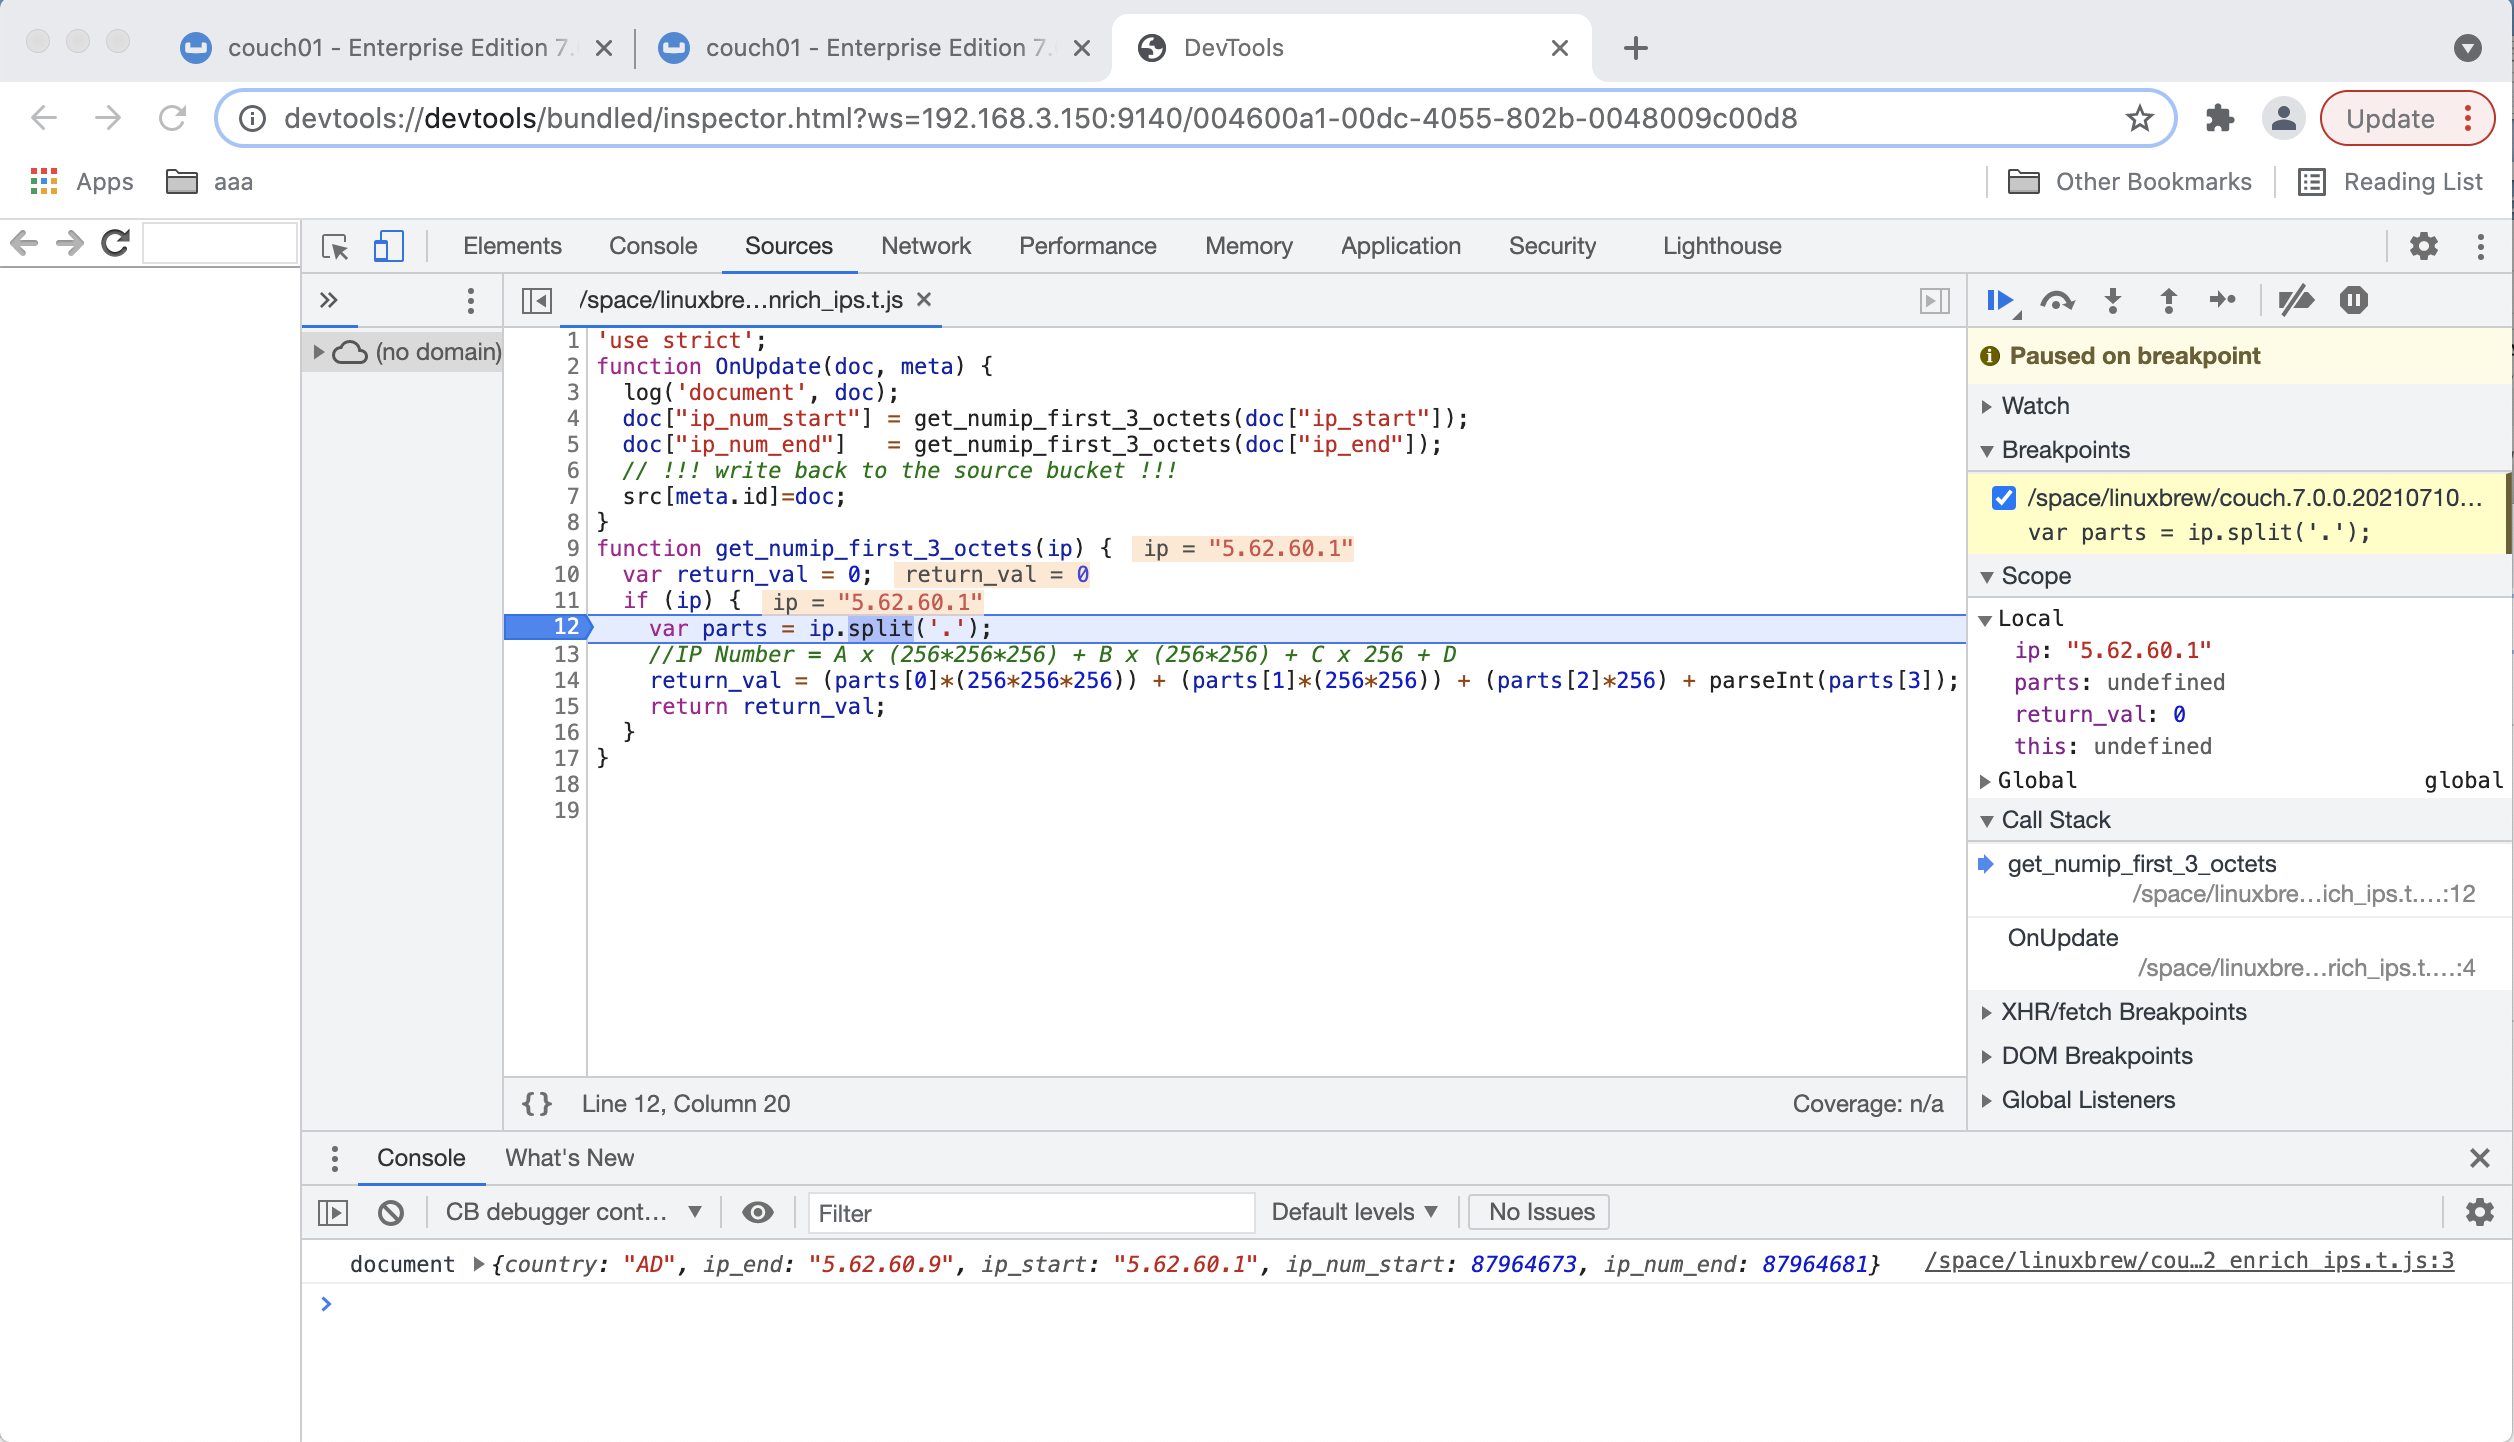
When the debugger comes up it may or may not display your Eventing Function’s JavaScript. If you do not see your code you may have to Click on the step button once or twice in the debugger (see the highlighted RED box above and below). Once you see your Function’s JavaScript code adjust the sizes of the various debugging windows to your personal preference.
-
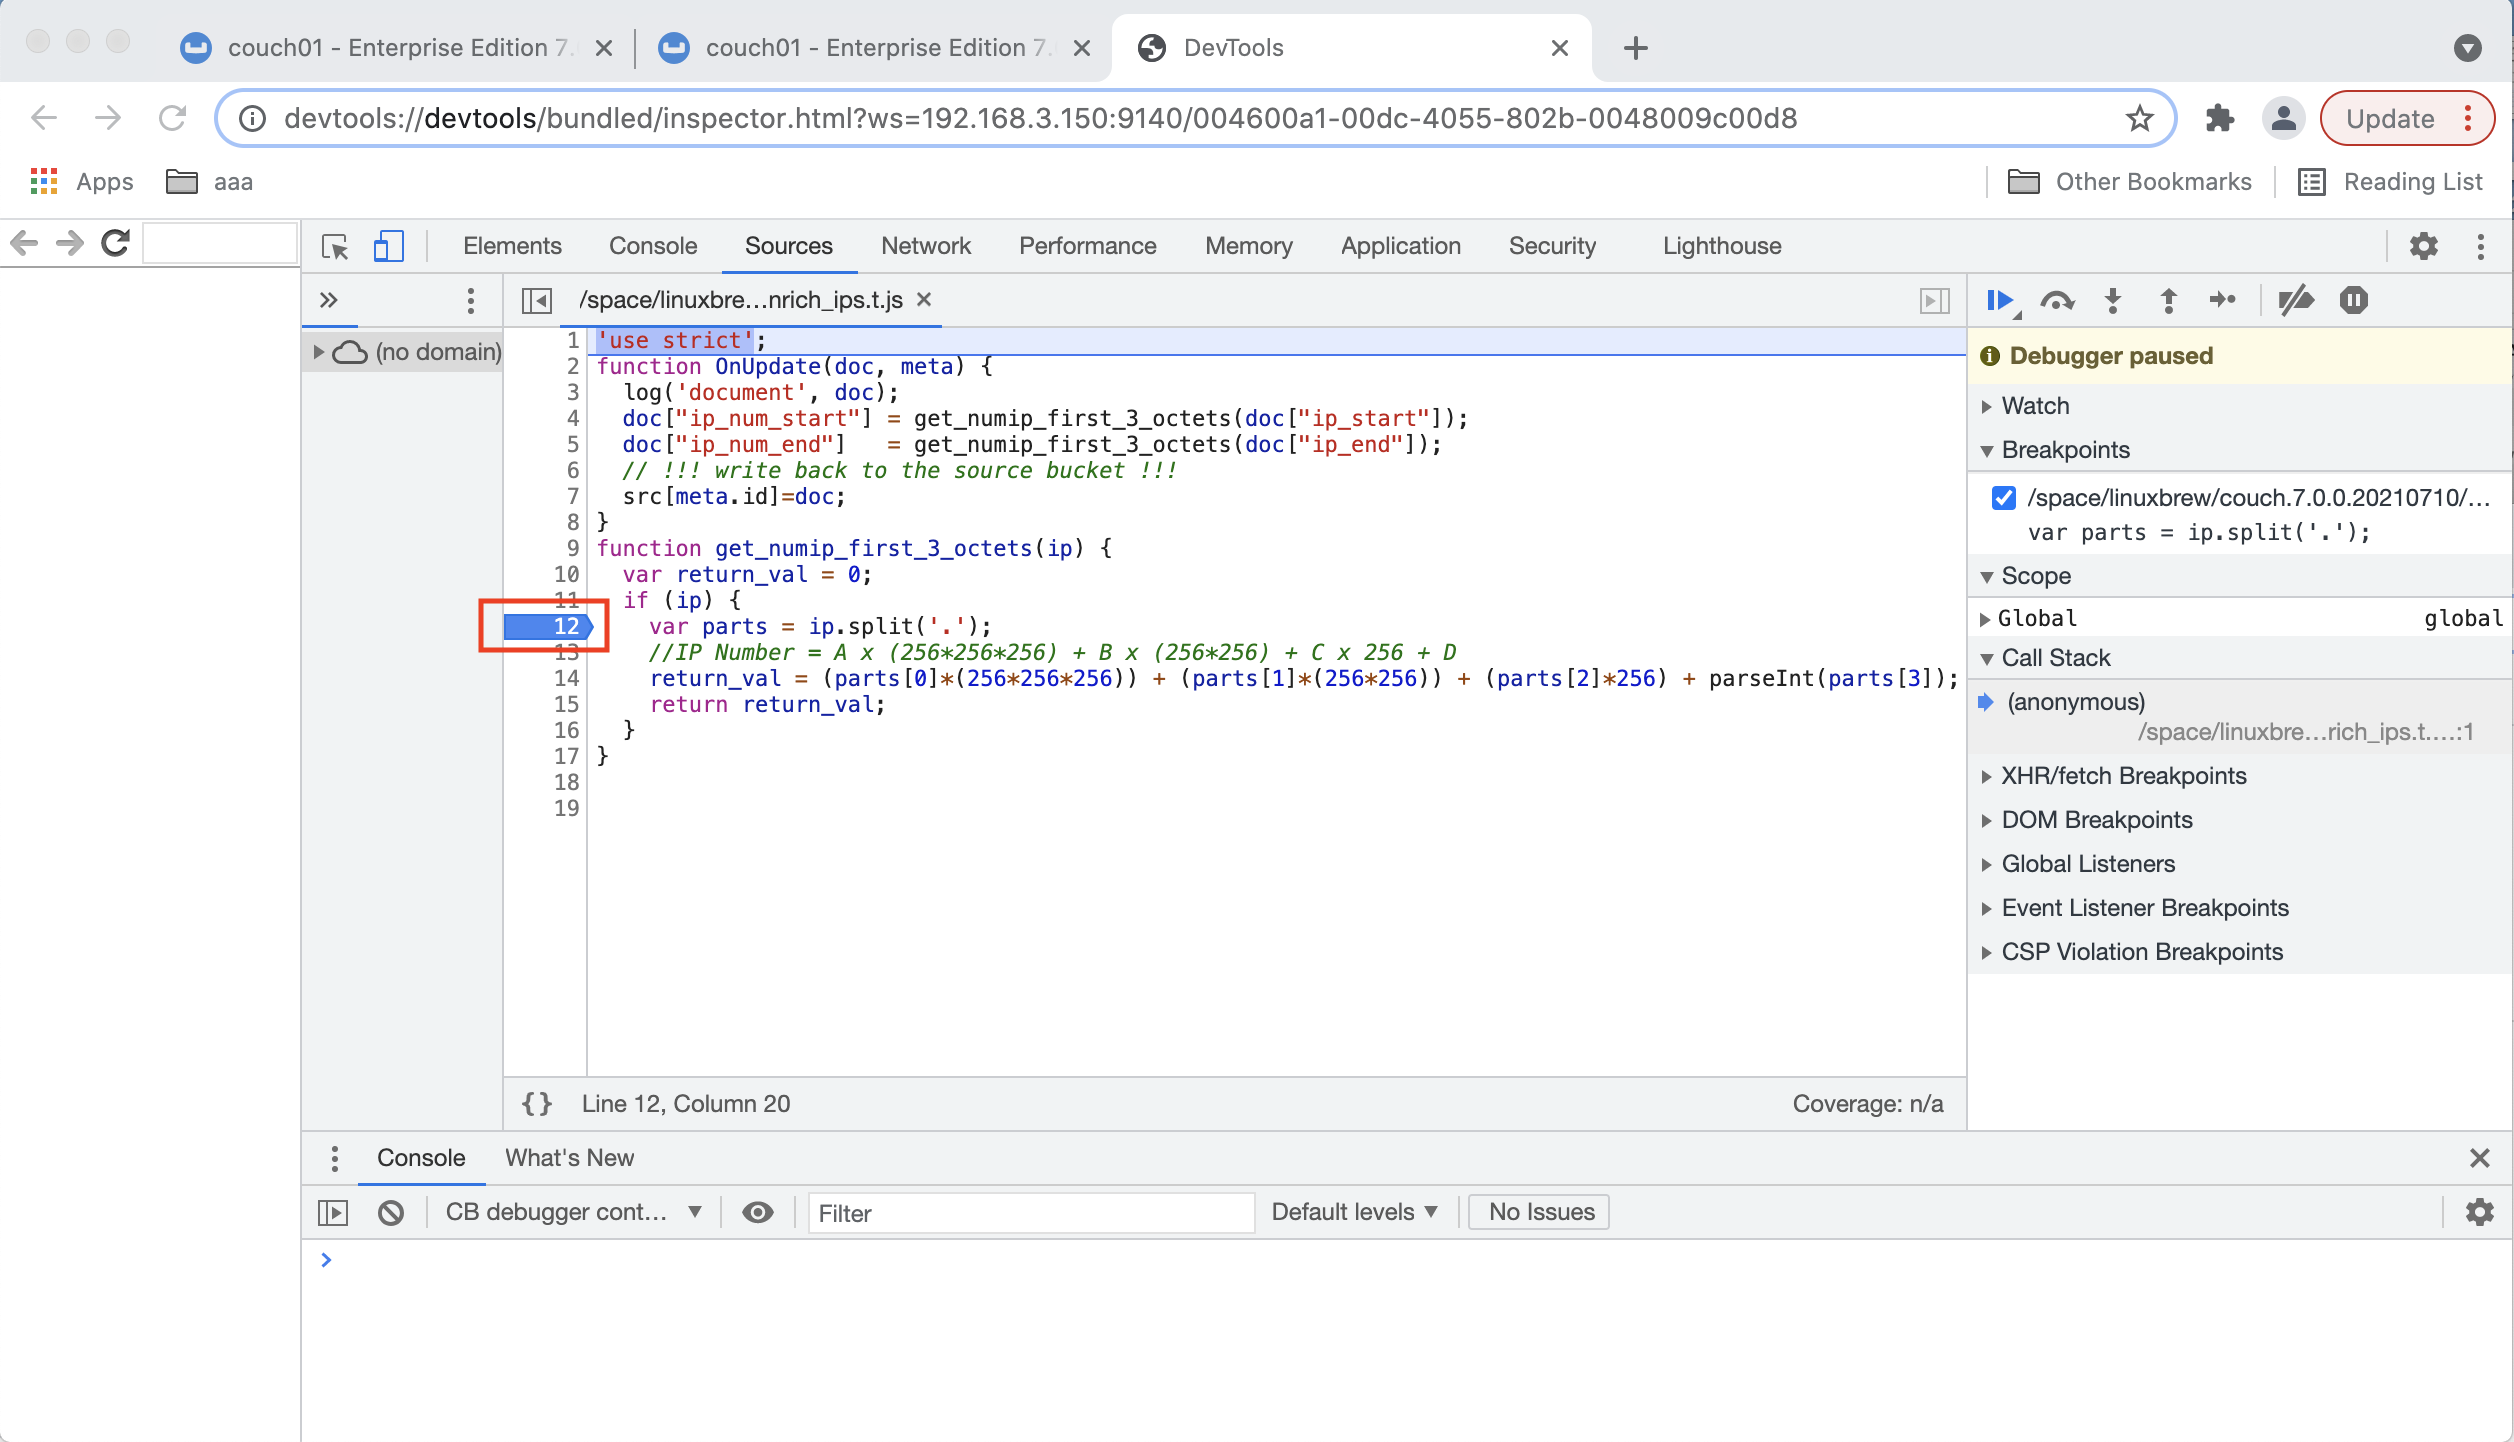
Set a breakpoint at line 12 by clicking on the line # on the left (see the highlighted RED box below). Once a break point is set it will display a bold BLUE bookmark.
-
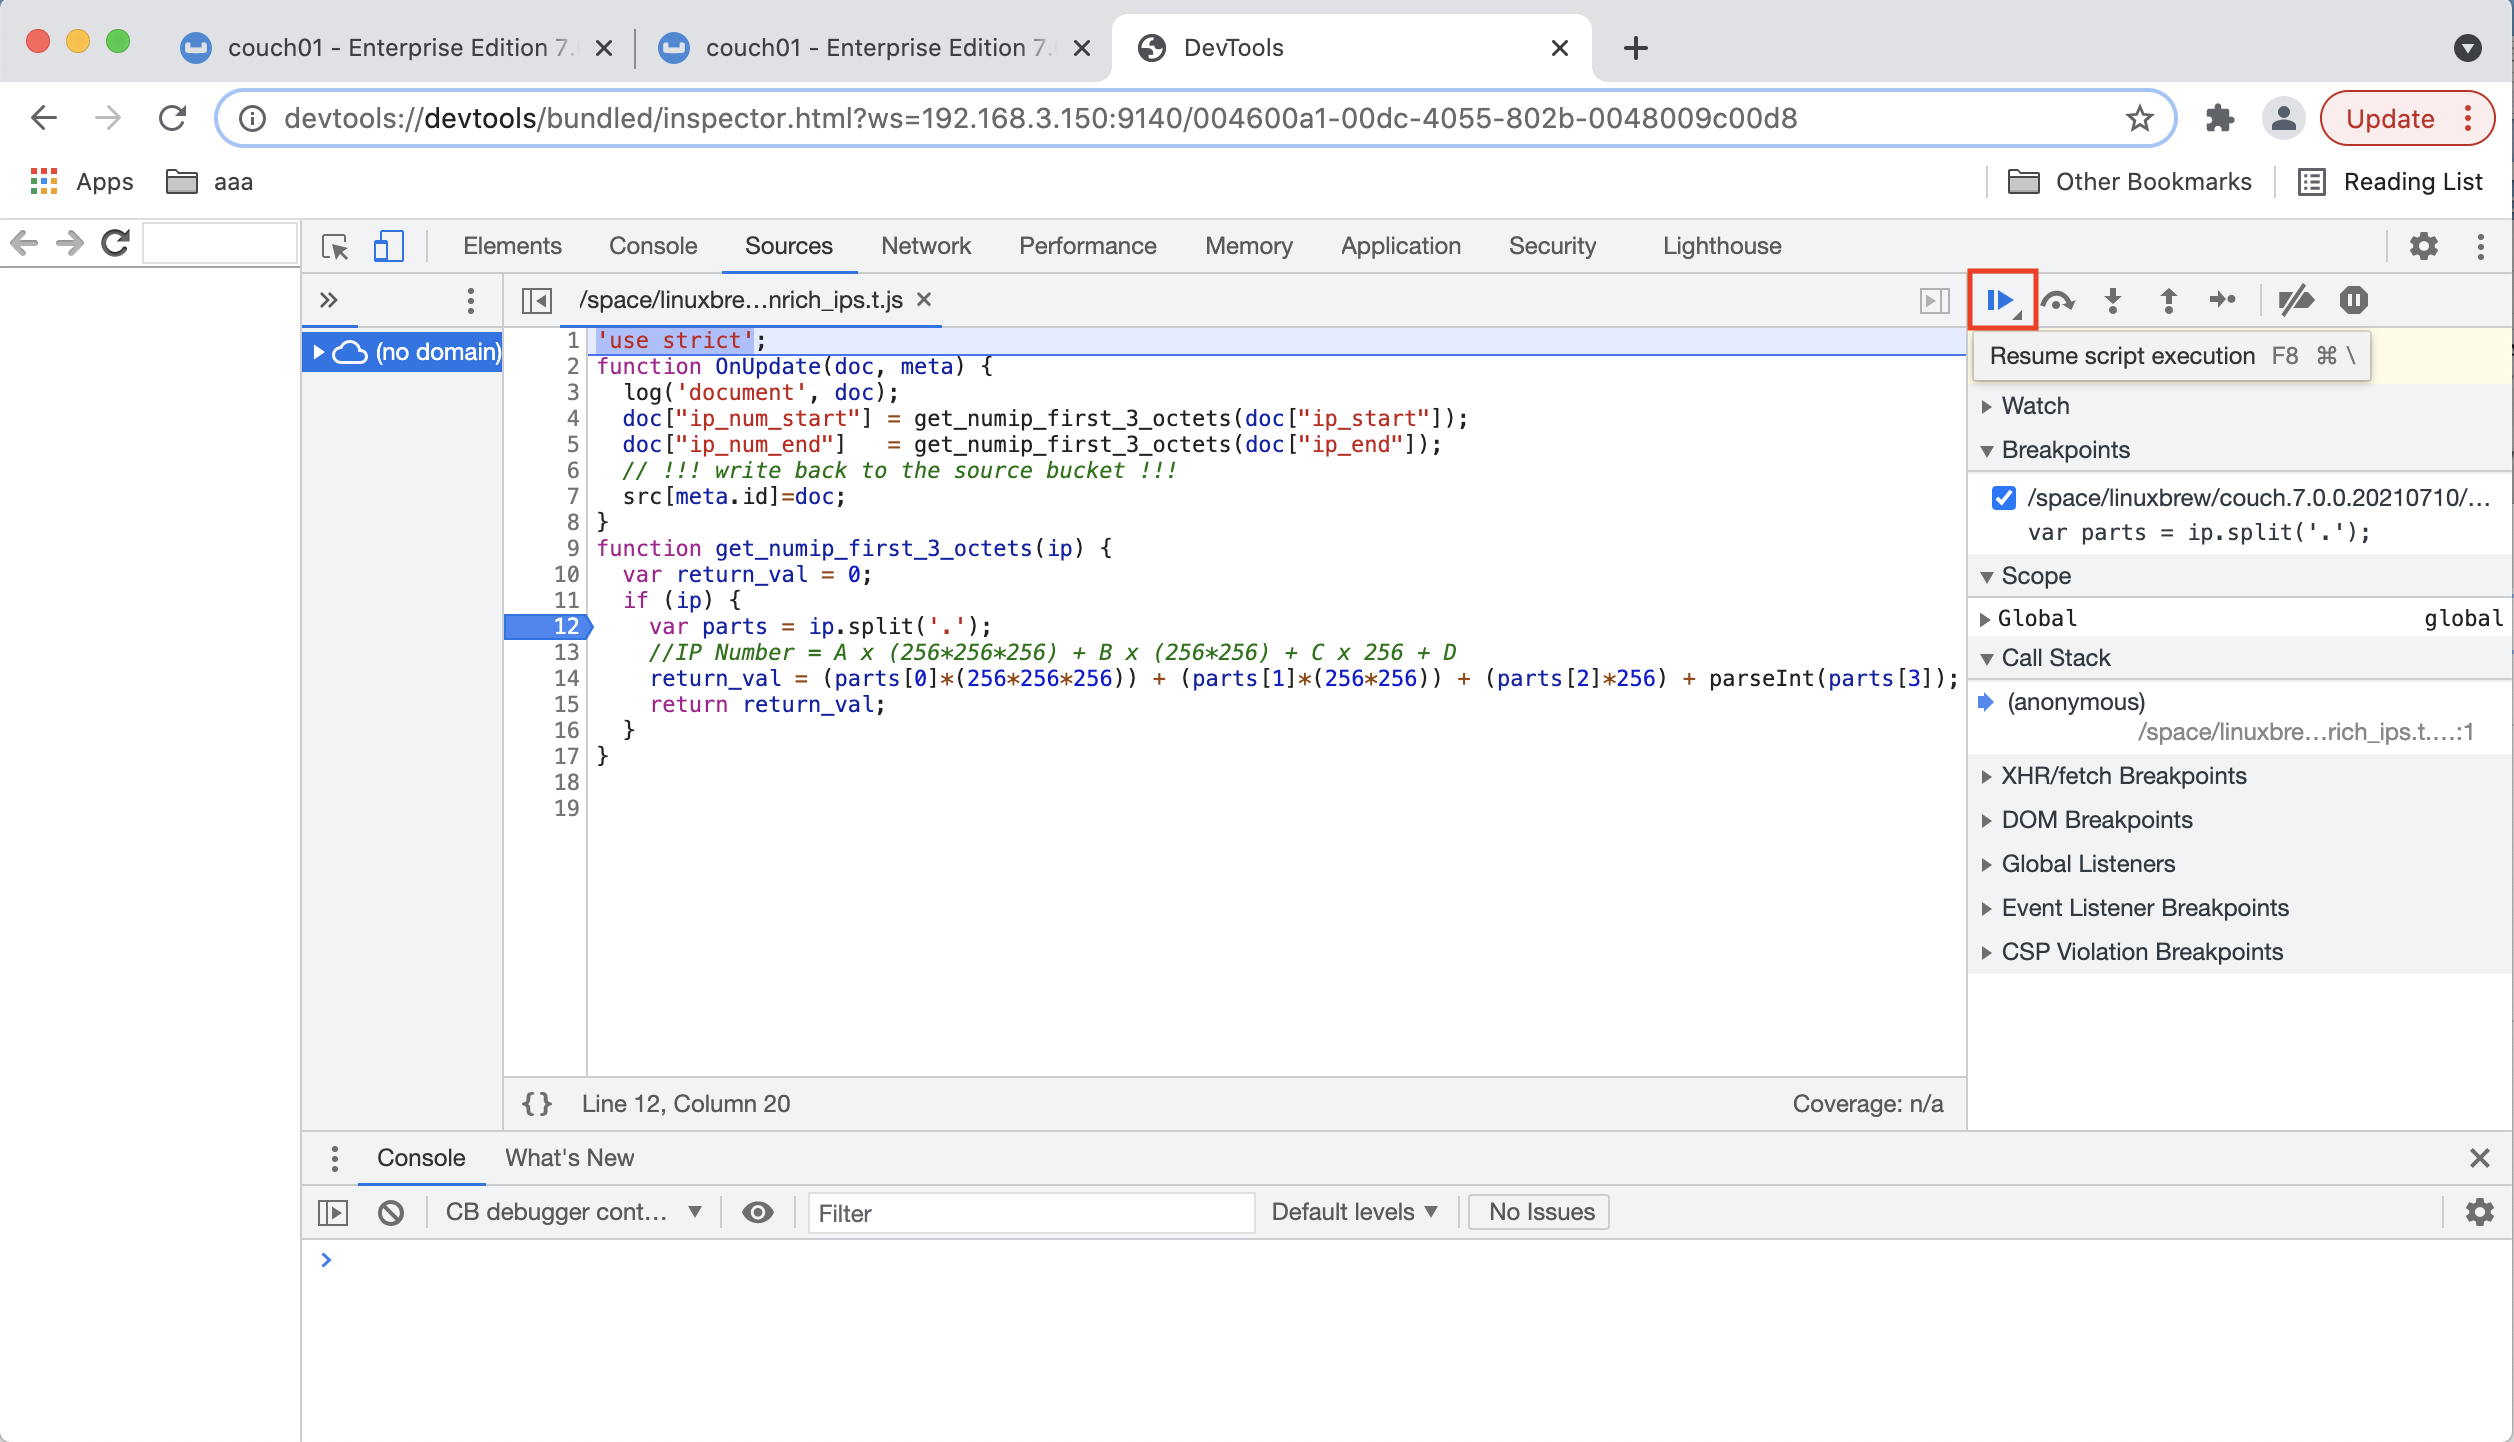
Click the Resume button in the debugger to continue execution and to run until the break point you set.
-
The Eventing Function will execute (accessing KV and/or SQL++ and interacting with REST endpoints) as it would in production until it hits your breakpoint.
-
Note the variable values displayed while at the breakpoint set at line 12. Click on the Resume button a second time to finish executing your Function.
-
The debugger is done return to the tab/window where your one-time debugging URL was created and Click Stop debugging. If you need to debug another mutation Click Debug again and repeat the process.
-
If you are done with all needed interactive debugger disable debugging via the SETTINGS.
Possible Debugging Problems and Issues
-
During a debugging session this window must remain active. When you are presented a debug URL you must copy then paste it into a new browser window (described below). If you are using the UI to create the mutation, you must use a different tab/browser window to create the mutation. A debug session will also be terminated if from the Debugging pop-up (or debugging dialog), you can click Stop Debugging.
-
The URL you copied is valid only for a single mutation, to debug another subsequent mutation you must click Stop debugging button and capture click Debug again to get a fresh one-time debugging URL.
-
You are trying to debug a Couchbase server via a NAT’d IP Address and the debugger doesn’t work because the generated one-time debugger URL doesn’t reflect the NAT.
Example NAT’d setup
Couchbase server is running 192.168.3.150 key ports 8091 for UI and 9140 for websocket devtools debugger
A public NAT for 192.168.3.150 is 4.71.116.187 (for both ports 8091 and 9140) in your firewall
Solution:
On the actual Couchbase server, i.e. 192.168.3.150, set up an alternate address for the debugger as follows for 7.0 GA (and also 6.6.3):
curl -X PUT http://$CB_USERNAME:$CB_PASSWORD@localhost:8091/node/controller/setupAlternateAddresses/external \
    -d hostname=4.71.116.187 -d eventingDebug=9140
The Debug URL is now correct and needs no hand editing.
To delete/remove the alternate address on 192.168.3.150 on the actual server host, i.e. 192.168.3.150 run the following:
curl -X DELETE http://$CB_USERNAME:$CB_PASSWORD@localhost:8091/node/controller/setupAlternateAddresses/external \ -d hostname=4.71.116.187 -d eventingDebug=9140 -
Although every effort is done to remain current Google changes the websocket URL format from time to time. You might have to manually alter the start of the debugging URL from chrome-devtools:// to just devtools:// and also at the end of debugging URL from js_app.html to inspector.html depending on the version of your Google Chrome browser due to a recent changes made by Google. Currently these manual changes (if needed) have to be done after pasting the URL into a new Chrome browser tab.
There are currently three known URL variants from the oldest Chrome release to newest Chrome release:
-
chrome-devtools://devtools/bundled/js_app.html
-
devtools://devtools/bundled/js_app.html
-
*devtools://devtools/bundled/inspector.html
-
-
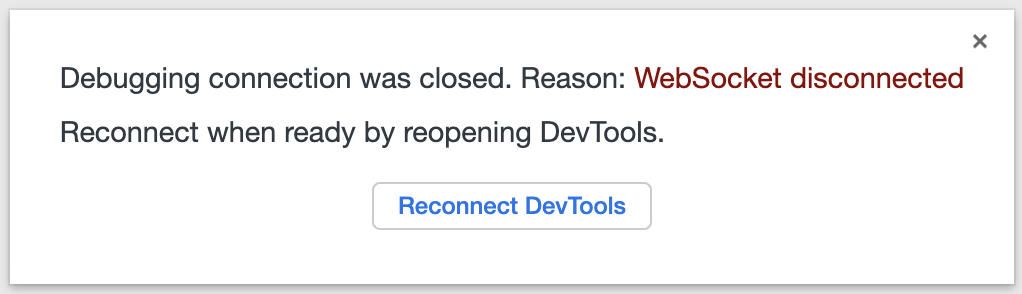
Potential issue with debugging International Components for Unicode (ICU)
In earlier versions 6.5.0, 6.5.1, and 6.6.0 users might experience bug MB-41508 a Chrome "WebSocket Disconnected" when debugging Eventing functions that call either toLocaleString() or Intl.DateTimeFormat. Essentially the file "icudtl.dat" which provides support for International Components for Unicode (ICU) is not in the needed location. The following step (copying the Chrome "icudtl.dat" file) is necessary only for development or staging clusters as users aren’t expected to spawn a debugger in a live production environment. Typically this issue will occur when the debugger hits an ICU function like Intl.DateTimeFormat or toLocaleString, the result is your debugging session is disconnected as follows:
To fix the issue in Chrome you merely need to copy a file on the server to the expected file system location.
-
Linux
cp -p /opt/couchbase/bin/icudtl.dat /opt/couchbase/var/lib/couchbase
-
macOS
cp -p /Applications/Couchbase\ Server.app/Contents/Resources/couchbase-core/bin/icudtl.dat /Users/$USER/Library/Application\ Support/Couchbase/
-
Transpiler and Source Map
A transpiler accepts source code provided as input from one high-level programming language and produces an equivalent code in another high-level programming language.
Couchbase Server uses a native transpiler. This transpiler converts the Eventing Function’s JavaScript syntax into a pure JavaScript representation that the JavaScript engine can understand. If this transpiler was unavailable, then the JavaScript engine would have failed to compile any native SQL++ queries or curl() functions.
When your source code is transformed, debugging becomes a problem because we must know where the original code is. Source maps solve this problem by providing a mapping between the original and the transformed source code.
A source map, generated by our native transpiler provides a mapping between the transpiled code and the original function Eventing Function JavaScript code. Debugging is easy as the debugger detects the source map and presents the code to the developer in the original Eventing Function JavaScript format.
Upon source map detection, a text confirmation flag gets displayed in the bottom of your browser’s debug window as a very long comment an example is highlighted below:
//# sourceMappingURL=data:application/json;base64,eyJ2ZXJzaW9uIjozLCJzb3VyY2VzIjpb truncated
Modifying the Debug Port
The Eventing Service Debugger port, eventing_debug_port (9140), is an internal port and is one of the ports that are configured by the ns_server. Note this port is not supported for external access outside of the cluster and should only be used in development environments. To modify this port setting (Linux example):
-
Edit the /opt/couchbase/etc/couchbase/static_config file to add the new eventing_debug_port and the new port-number information. For example, to change the Eventing debugging port from 9140 to 9444, you would add the following line (enclosed in braces and terminated by a period):
{eventing_debug_port, 9444}. -
If Couchbase Server was previously configured, you’ll need to delete the /opt/couchbase/var/lib/couchbase/config/config.dat file to remove the old configuration.
For detailed information on the modifying ns_server port mappings, refer to Custom Port Mapping.
| Changing port mappings should only be done at the time of initial node/cluster setup as the required reset and reconfiguration will also purge all data on the node. |
Logging Functions
The Eventing Service creates two different types of logs:
-
System Log
-
Application Logs
Couchbase Server creates different application log files depending on the level and severity of the reported problem, as configured during Function definition
System Log
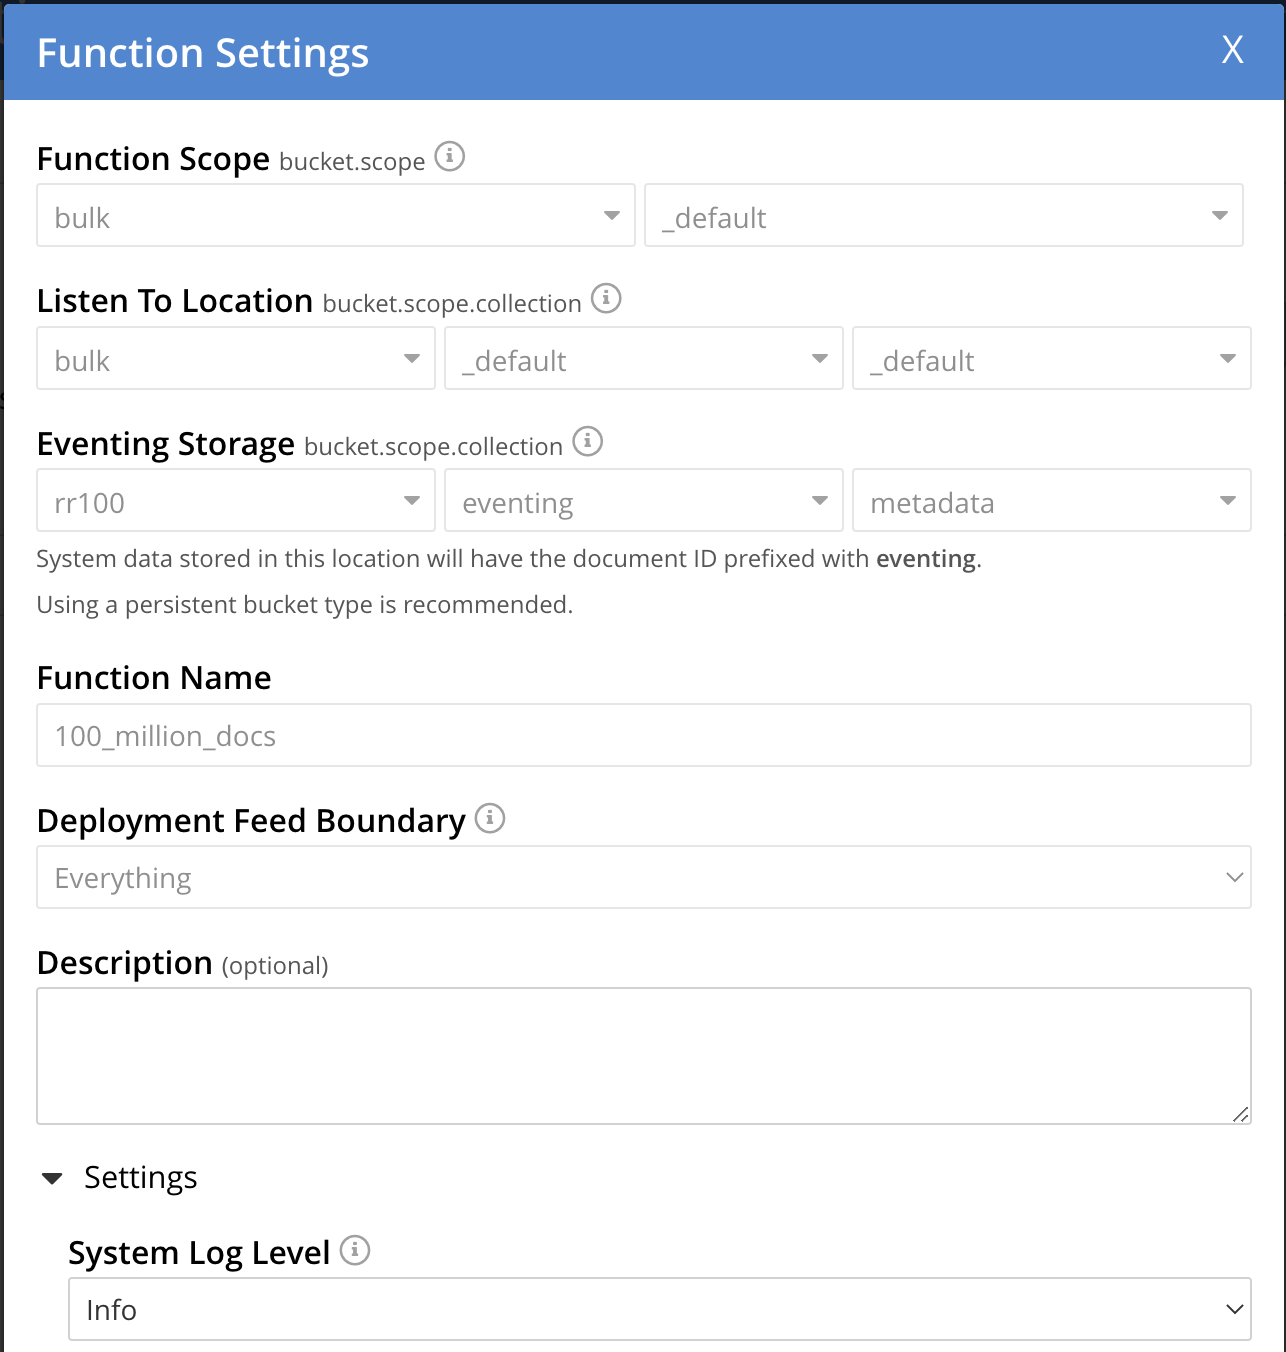
For the Eventing Service, Couchbase Server creates a system log file named eventing.log (refer to Table 1 for filesystem location by platform). This file is common across all Eventing Functions. The system log file captures information related to general management and supervision of the Eventing service (not the business logic of the Function). In addition this log file also captures life cycle or housekeeping information of every individual Eventing function depending on the Function’s "System Log Level" setting. An end user cannot write a message (via their JavaScript code in an Eventing Function) to this log file it is intended for debugging for customers that are on support contracts.
| Platform | Location |
|---|---|
Linux |
/opt/couchbase/var/lib/couchbase/logs/eventing.log |
Windows |
C:\Program Files\Couchbase\Server\var\lib\couchbase\logs\eventing.log |
Mac OS X |
/Users/<user>/Library/Application\ Support/Couchbase/var/lib/couchbase/logs/eventing.log |
The eventing.log contains redactable user data and the log is collected using the cbcollect_info tool. For log rotation, refer to Log File Rotation.
The available logging levels are: Info, Error, Warning, Debug, and Trace (Info is the default since version 6.0). The level can be altered via the "System Log Level" choice in the Settings dialog of each individual Eventing function and impacts the detail and quantity of information sent to the System Log (but has no effect on a specific Function’s Application Log). Unless directed by support you should not change the "System Log Level".
Application Logs
Application logs allow you to identify and capture various business logic related activities and errors via user defined messages specific to each Eventing function.
You must have the appropriate RBAC privileges to view an Eventing Function’s Application log in the UI or via the REST API. The role of either "Full Admin" or "Eventing Full Admin" can see Application log or can access any Eventing Function’s Application log. For more information refer to Eventing Role-Based Access Control.
Unlike the System Log, Application logs can be viewed in the UI for any deployed function by clicking on the function’s “Log” hyperlink in the Eventing page.
Each Eventing function will have its own Application log based on the function name, e.g. the_function_name.log. (refer to Table 2 for filesystem path by platform). The information that goes to these log files is solely dependent the logic of the Function via log(…) statements put inside the individual Eventing Function’s JavaScript code. Unlike the system log there is currently is no logging level for Application logs. Application logs are primarily used for development and debugging business logic.
function OnUpdate(doc, meta) {
    log('document', doc);
    try {
        var response = curl(
            'http://localhost:3000/notify',
            {method : 'POST', data : doc}
        );
        log('curl', response);
    } catch (e) {
        log('error', e);
    }
}
Application logs receive user defined messages when a log(…) statement is encountered in the Function’s JavaScript code (they do not have a Log Level).
As a best practice the use of log(…) messages with try catch blocks can greatly assist Eventing Function development and debugging.
Below a function processes one mutation from the test bucket travel-sample but has an undefined JavaScript variable a without a try catch block.
function OnUpdate(doc, meta) {
    if (meta.id != "airport_1255") return
    log('id', meta.id);
    // undefined variable 'a' stops processing, an error indicator [X] will be
    // displayed via selecting "View JavaScript" when the function is deployed.
    // Failure(s) will also be logged in Eventing Stats: _function_name_ in the
    // UI 'Server > Statistics' view for the charts of the _function_name_
    if (a == 1) {
        log('a is 1')
    }
    // never reached
    log('complete')
}
Only the first of three log messages is emitted and the processing stops and is marked as failed in the statistics.
2020-02-09T07:12:17.936-08:00 [INFO] "id" "airport_1255"By selecting the "View JavaScript" button when the function is deployed a [X] indicator at the exact line in the JavaScript code failed will be displayed. By hovering over the [X] indicator more information is revealed.
However, by adding a try catch block the root cause of the failure is easily apparent, and the function is considered processed (without a failure) because the error is caught and handled in the function.
function OnUpdate(doc, meta) {
    if (meta.id != "airport_1255") return
    log('id', meta.id);
    try {
        if (a == 1) {
        log('a is 1')
        }
    } catch (e) {
        log('error', e);
    }
    log('complete')
}
The output now indicates the exact error that occurred via the Function’s Application log as follows:
2020-02-09T07:12:17.936-08:00 [INFO] "id" "airport_1255"
2020-02-09T07:12:17.936-08:00 [INFO] "error" "ReferenceError: a is not defined"
2020-02-09T07:12:17.936-08:00 [INFO] "complete"
As previously indicated, by selecting the "View JavaScript" button when the function is deployed a [X] indicator at the exact line in the JavaScript code failed will be displayed. By hovering over the [X] indicator more information is revealed.
Application logs can also record summaries of low level issues and exceptions once a minute per worker. For example if you have 1M items that all throw the same exception, you will only see a few messages with the line number along with a count of each exception.
function OnUpdate(doc, meta) {
    if (a == 1) {
        // never reached
        log('a is 1')
    }
    // never reached
    log('complete')
}
Running the above on a source keyspace travel-sample._default._default will result in a failure count of 31,951 however the errors will be summarized into a single line per worker.
2021-07-19T15:35:44.895-07:00 [INFO] {"count":31591,"exception":"\"ReferenceError: a is not defined\"","file":"test_summary.js","line":2,"since":"2021-07-19T15:35:44","srcLine":"if (a == 1) {","stack":"ReferenceError: a is not defined\n at OnUpdate (test_summary.js:3:5)"}This summarization greatly reduces the size of the Eventing logs in the event there is a low level issue or a syntax error that detected only at deploy time.
You can access a Function’s Application log file using the UI by selecting the Function name and clicking on the 'Log' hyperlink/button or by opening a terminal and issuing Linux commands such as cat, more, head, tail, or ‘tail -F’ on a specific Eventing function’s log.
Couchbase Server creates an individual log file for every Function in the cluster on each Eventing node. Application logs will only contain information for the mutations processed on a given Eventing node.
By default, the maximum size of a node’s Application log file is 40MB, and the number of log files before rotation is 10. Unlike system logs, the Application logs are user-configurable in number and size.
| The cbcollect_info tool does not collect the Application log files. |
| Platform | Location |
|---|---|
Linux |
/opt/couchbase/var/lib/couchbase/data/@eventing/ |
Windows |
C:\Program Files\Couchbase\Server\var\lib\couchbase\data\@eventing\ |
Mac OS X |
/Users/<user>/Library/Application\ Support/Couchbase/var/lib/couchbase/data/@eventing/ |
| During Cluster setup, if you have chosen a custom path, then the path for Application logs is same as that of the selected Indexes Path. The @eventing folder in the selected Indexes Path stores the Application logs. |
To configure an Application log, use the REST endpoint settings option. Note you must always specify deployment_status (deployed/undeployed) and processing_status (paused/not-paused) when using this REST endpoint.
Sample URL: 192.168.1.5:8091/_p/event/api/v1/functions/<Function_name>/settings
Sample Payload:
{
  "settings":
    {
      "deployment_status":false,
      "processing_status":false,
      "app_log_max_files": 10,
      "app_log_max_size": 10485760
    }
  }
The sample payload above illustrates that the system stores 10 application log files and each file records about 10 MB of data.
At some point in time, old application log files that are no longer necessary need to be deleted to make way for new log records. When an Application log file reaches the set limit, a new log file gets created. All the recorded information from the active log file gets transferred to this newly created file.
For illustration, consider case_1_enrich_ips from the example Data Enrichment as the name of the Function. A corresponding Application log file, case_1_enrich_ips.log, gets created in the Couchbase cluster. Whenever the case_1_enrich_ips.log reaches 10MB in size, assuming the maximum size of an Application log file is 10MB and the number of log files before rotation is 10, the system automatically generates the case_1_enrich_ips.log.1 file, during its first iteration. The file case_1_enrich_ips.log transfers all the log information to this new log file. For this illustration, since the number of log files is 10, the system stores 10 such files, the currently active log file along with 9 truncated files, at any given instance.
Log Redaction
You can use logs for multiple purposes ranging from security, monitoring, and diagnostics. Suppression of sensitive data such as personally identifiable information (PII), hostnames, internal asset information, credit card details, during the logging operation is termed as log redaction. Organizations implement log redaction as part of their legal compliance and security risk mitigations.
Couchbase Server provides a capability to redact sensitive user data from getting captured in the logs. All sensitive data are scrubbed and gets removed from the log files. Post redaction, log files can be shared for troubleshooting without disregarding any regulatory compliance.
| Log redaction is applicable only for System logs and not for Application logs. |
For details, see Understanding Redaction.