Unstable Nodes
- concept
Nodes that periodically become unavailable but recover before the auto failover timeout expires are considered unstable. This page describes what unstable nodes are and how to detect them.
About Unstable Nodes
An unstable node periodically becomes unavailable but recovers before the auto failover timeout expires. Nodes can become unstable for a variety of reasons, such as:
- Network hardware issues
-
For example, a network port that’s flapping (periodically failing) can cause intermittent connectivity issues.
- Kernel TCP/IP memory pressure
-
When a node is under heavy network load, the Linux kernel’s TCP/IP stack can run low on memory. The kernel may respond by refusing connections and dropping packets, which can cause nodes to become unreachable until the memory shortage is resolved.
- CPU, Memory, or Disk Resource Issues
-
When a node is under heavy CPU, memory, or disk I/O load, it may struggle to meet the demands of the cluster. Hardware issues with any of these resources can also cause instability.
Any of these issues can cause periods where the node is unreachable. In some cases, the node may continue to be unreachable until it’s automatically failed over. However, the node can recover before the auto failover timeout expires, which lets it potentially repeat the cycle again.
An unstable node can cause performance issues for the cluster, even if it does not lead to automatic failover. When a node is unreachable, other nodes in the cluster may experience increased latency as they attempt to communicate with the unreachable node.
Tracking Instability Using Metrics
Couchbase Server provides metrics to help you monitor its performance. See Metrics Reference for more information about Couchbase Server metrics.
To track instability, you can monitor the cm_node_unreachable_total metric.
It is a cross-node counter metric that reports how many times a node has been unable to reach another node.
When you see multiple nodes incrementing this counter for the same node, it may indicate the node is unstable.
What the Metric Reports
The following screenshot shows an example of using Prometheus to view the cm_node_unreachable_total metric.
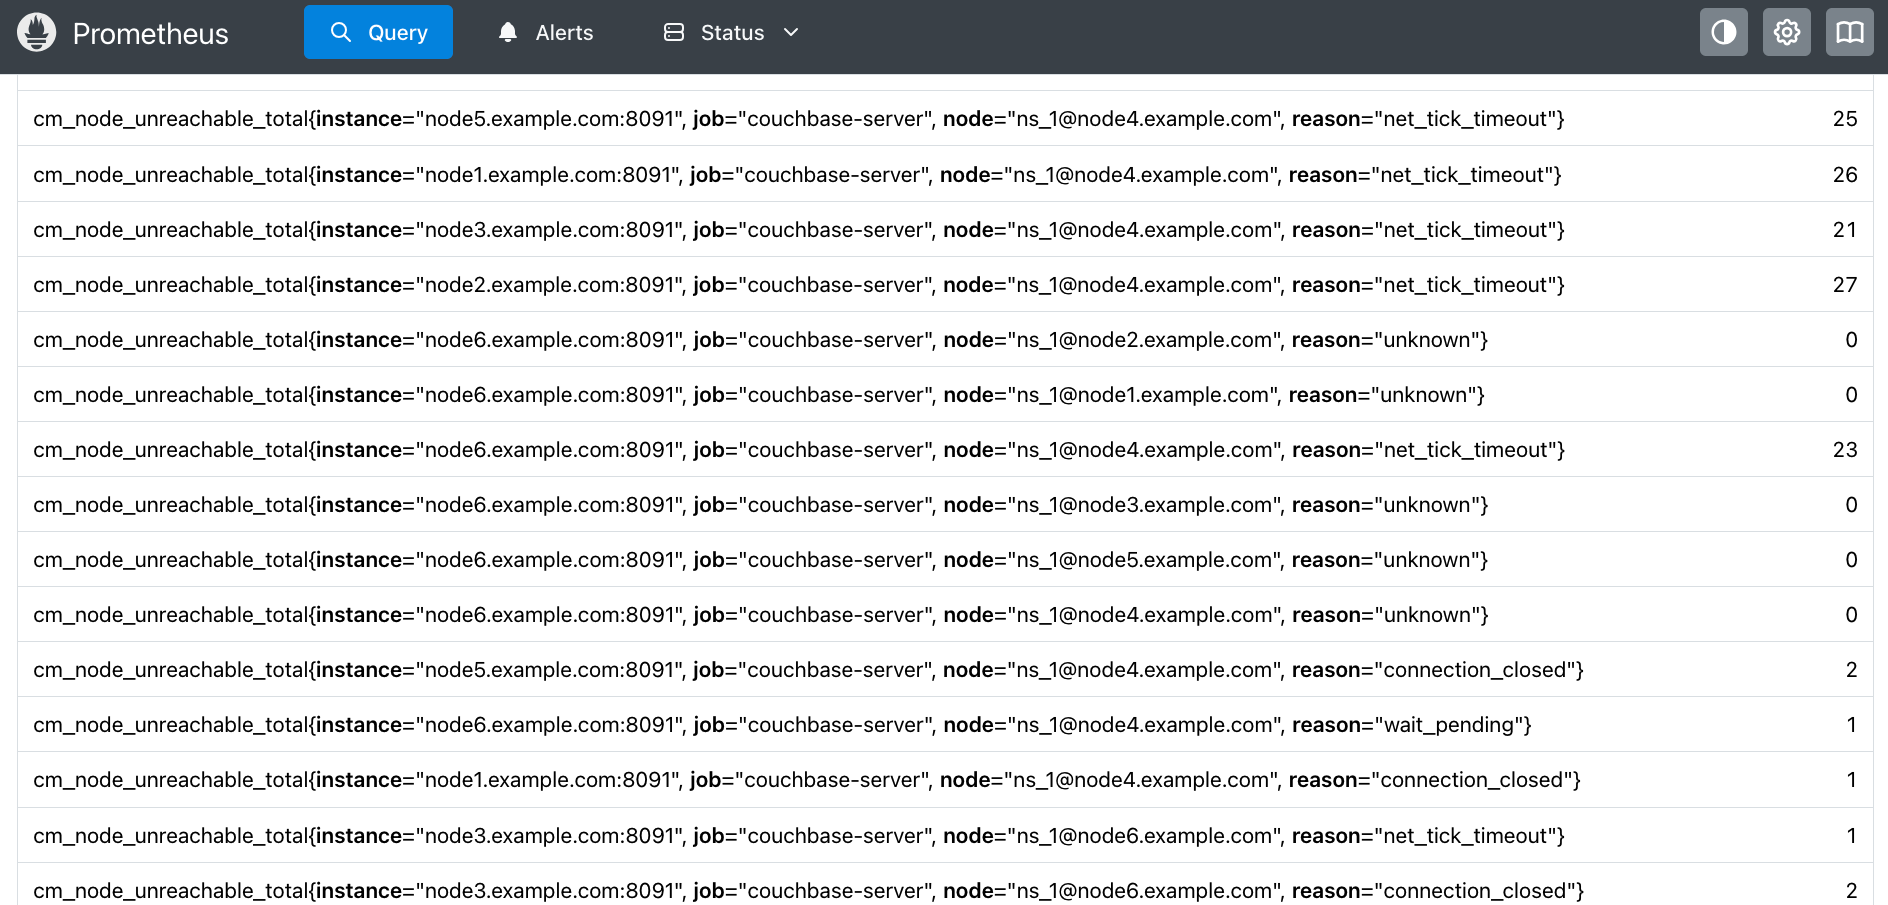
Each entry represents a count of the times a node has found another node unreachable for a particular reason. For example:
cm_node_unreachable_total{instance="node1.example.com:8091",
                          job="couchbase-server",
                          node="ns_1@node4.example.com",
                          reason="net_tick_timeout"} 26
The labels in the metric identify the nodes and the type of issue:
-
The
instanceis the node which is reporting another node as unreachable. -
The
jobis the Prometheus job that you configured to scrape Couchbase Server metrics. -
The
nodeis the node being reported as having issues. It uses the Erlang node name format. The portion before the@is the name of the Erlang process running on the host. -
The
reasonis the type of issue the instance (reporting node) observed in its connection to the node. The possible reasons are:-
connection_setup_failed: Setting up the connection failed (after thenodeupmessages were sent). -
no_network: The reporting node has no network connection. -
net_kernel_terminated: The Erlangnet_kernelprocess terminated. -
shutdown: The connection shut down for an unknown reason. -
connection_closed: The node closed its connection with the instance. -
disconnect: The reporting node forced a disconnection from the node. -
net_tick_timeout: The network distribution heartbeat timed out. -
send_net_tick_failed: The reporting node was not able to send the distribution heartbeat via the connection. -
get_status_failed: The reporting node failed to retrieve status information from the connection.
See the Erlang documentation for
nodedown_reasonfor more details about these errors. -
In the previous example, node1.example.com has reported that it was unable to reach node4.example.com 26 times due to a network distribution heartbeat timeout.
In the screenshot, you can see that multiple nodes have reported that node4.example.com was unreachable for several reasons.
These reports may indicate that node4.example.com is unstable.
Depending on the reason, the reporting node may increment its metric counter immediately or after a delay.
For example, a node reports a connection closed error immediately when it happens.
However, it only reports a net_tick_timeout after the timeout period has elapsed.
Therefore, you may see a lag between issues that nodes report immediately and ones they report after a delay.
|
Spotting Unstable Nodes
When a node is unstable, you see a pattern of multiple nodes incrementing their cm_node_unreachable_total counters for it.
The following screenshot shows a Prometheus graph of the metric over a period of 50 minutes.
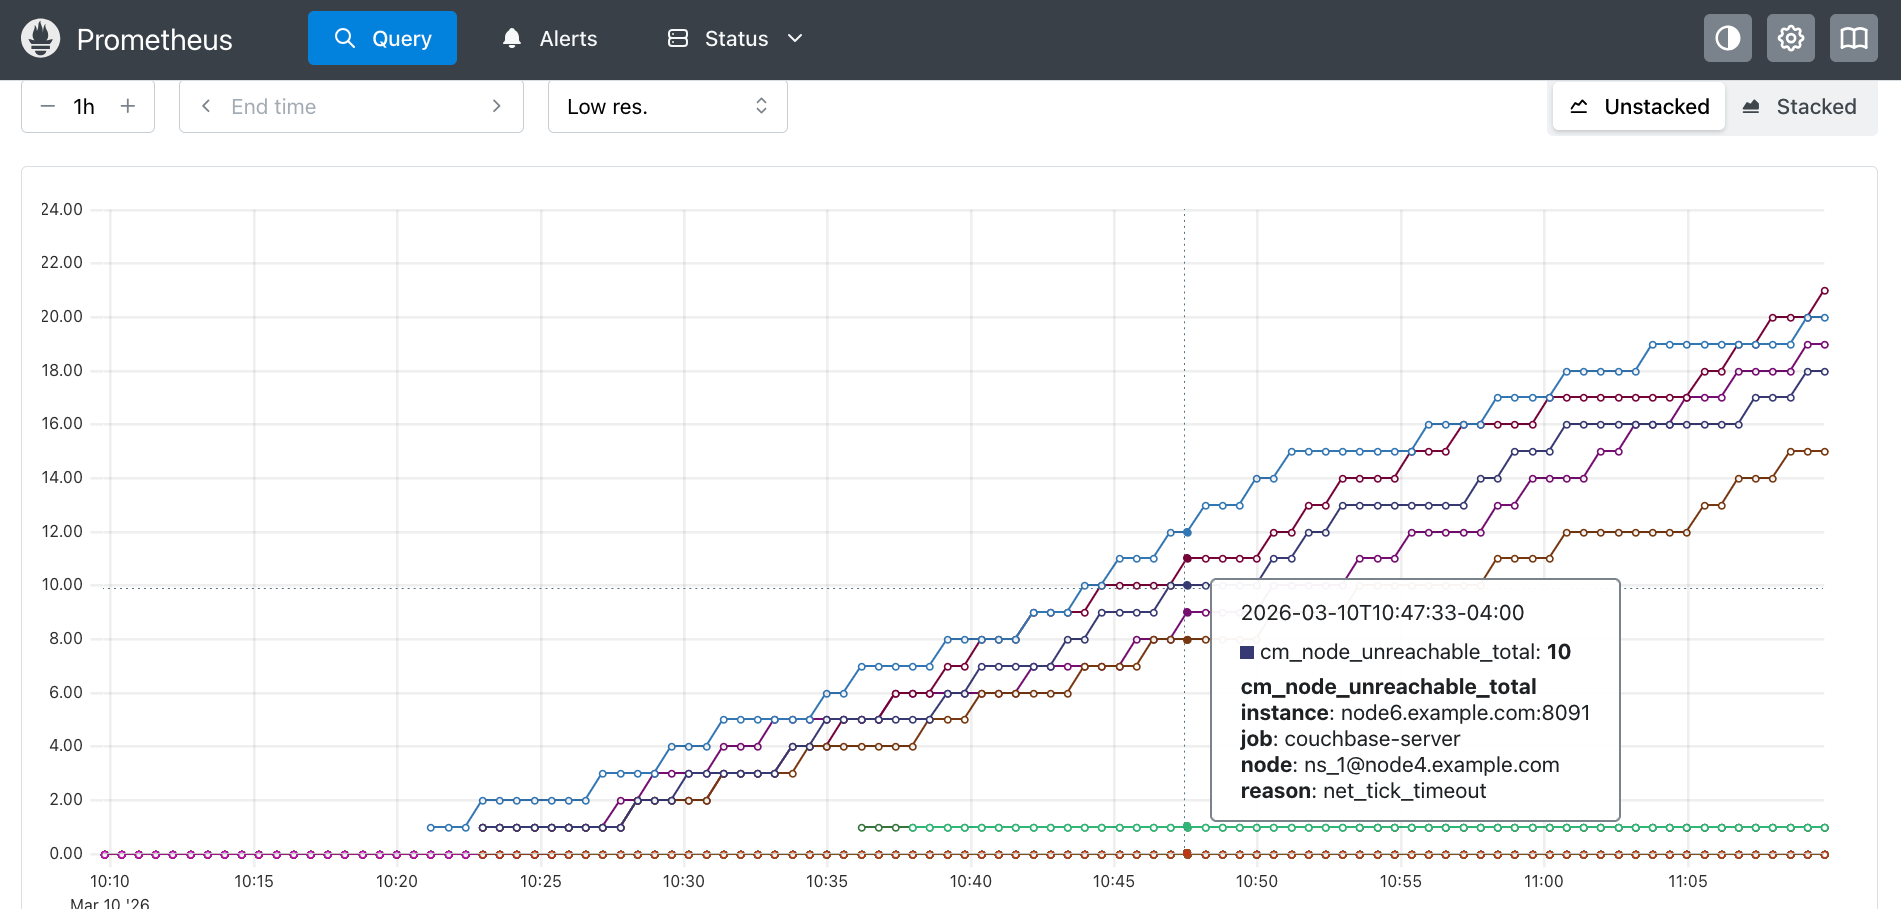
The lines in the graph show nodes incrementing their cm_node_unreachable_total metric counters when they were unable to reach node4.example.com.
The reason label for most of these counters is net_tick_timeout errors, although there are several reports of connection closed.
You can see there are periods of stability (where the values do not increment) followed by multiple nodes incrementing their counts around the same time.
See Monitor Node Stability for steps you can take to monitor node stability.