Architecture
- Developer Preview
Couchbase monitoring and observability stack [CMOS] is built primarily with Grafana-based components mainly for the following reasons:
-
Already in use with Prometheus exporter and similar on Couchbase Server
-
Industry standard and OSS with various integration points for other pipelines
-
Existing options to scale from single node up to cloud scale easily
We already expose Prometheus endpoints for node-level information on a Couchbase Server instance starting from the Couchbase Server 7.0 release. We expose Couchbase logs using Fluent Bit, primarily on Kubernetes-based deployments but can get deployed on-premise deployments as well.
One of the core capabilities of CMOS is the Couchbase Cluster Monitor that provides cluster-level insights as well information via a Prometheus endpoint; it is a closed-source enterprise-only solution that integrates Couchbase knowledge and best practices into a reusable component.
Our observability stack is therefore a combination of Couchbase-specific components that provide that discrete knowledge and monitoring of the Couchbase cluster which are then plumbed into a generic Grafana pipline like below.
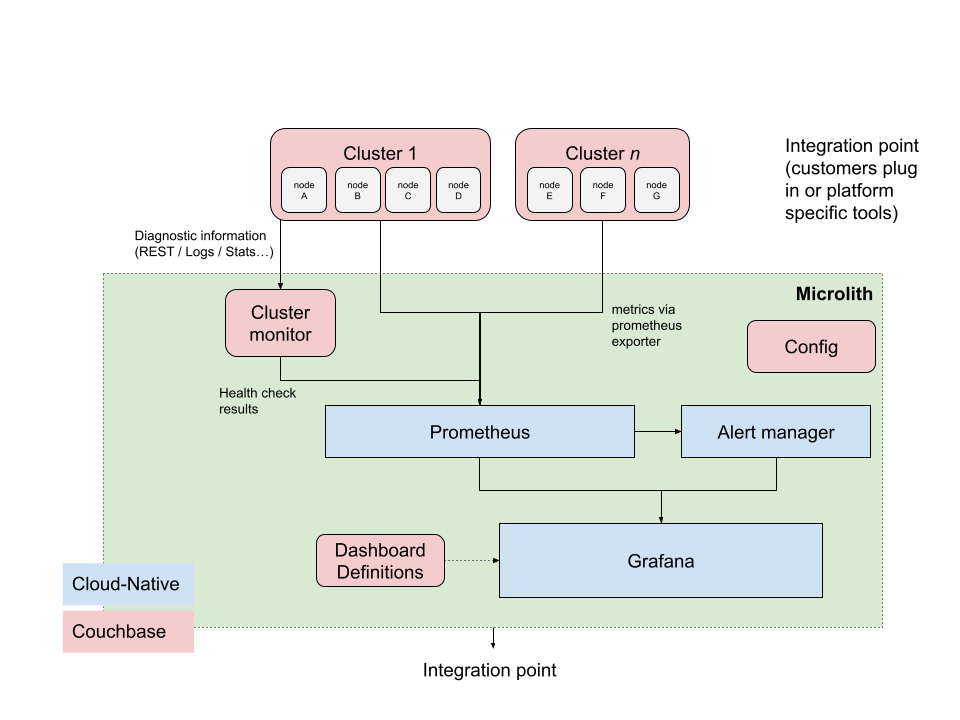
A complete working stack is provided with a Grafana UI to access it all.
We also provide the various Prometheus endpoints for people who want to plumb it into another stack, or federate Prometheus instances or some other alternative. They can reuse all the configuration provided, just not use Grafana for example.
Configuration points are also provided to tune the various alerts, dashboards and other configuration for a particular deployment, although basic deployment will provide a configured best practice version that is fully usable.