Configuration Options
- Developer Preview
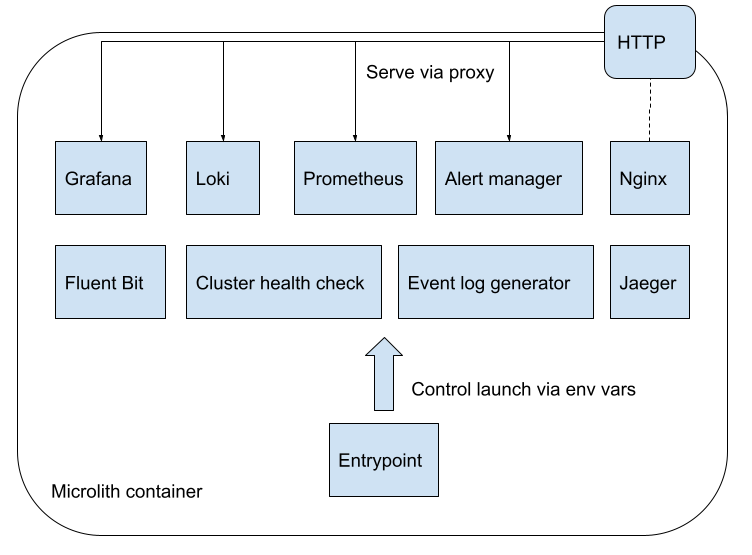
CMOS is designed as a microlith container with several services included in its stack. CMOS allows users to control these services in a fine grained manner. As shown in the above diagram, you can customize the installation by overriding the default service configuration values using environment variables or by providing a native configuration file for each service.
Disabling a Service
All the services of CMOS stack are enabled by default.
If you choose to disable a service, this is achieved by setting the corresponding environment variables of the docker container. The naming convention to be followed to disable a service is DISABLE_X, where X is the name of the service (e.g.,DISABLE_ALERT_MANAGER, DISABLE_GRAFANA, DISABLE_JAEGER, DISABLE_LOKI, DISABLE_PROMETHEUS and DISABLE_WEBSERVER).
Running behind a reverse proxy
CMOS can be run behind a reverse proxy in your deployments.
There are two ways of running it: on a subdomain (e.g. cmos.example.com), or on a sub-path (e.g. example.com/cmos).
If running on a subdomain, you do not need to change any CMOS configuration, just point your reverse proxy at port 8080 on the CMOS container.
If you are running on a sub-path, you will need to set the CMOS_HTTP_PATH_PREFIX environment variable to ensure all the services reflect this, for example docker run -e "CMOS_HTTP_PATH_PREFIX=/cmos" ….
|
If using sub-paths, the |
Logging
By default, logs can be either provided to standard output (stdout) or to service-based log files by setting the ENABLE_LOG_TO_FILE configuration value.
If file output is used for the logs, these files will appear in the /logs/ directory.
Further, if desired, these logs can externally be shared via a volume or bind mount.
To mount files into a container, use the docker -v <source>:<destination> command.
For further information, refer to the official documentation:
- https://docs.docker.com/storage/volumes/
- https://docs.docker.com/storage/bind-mounts/
Cluster Monitor
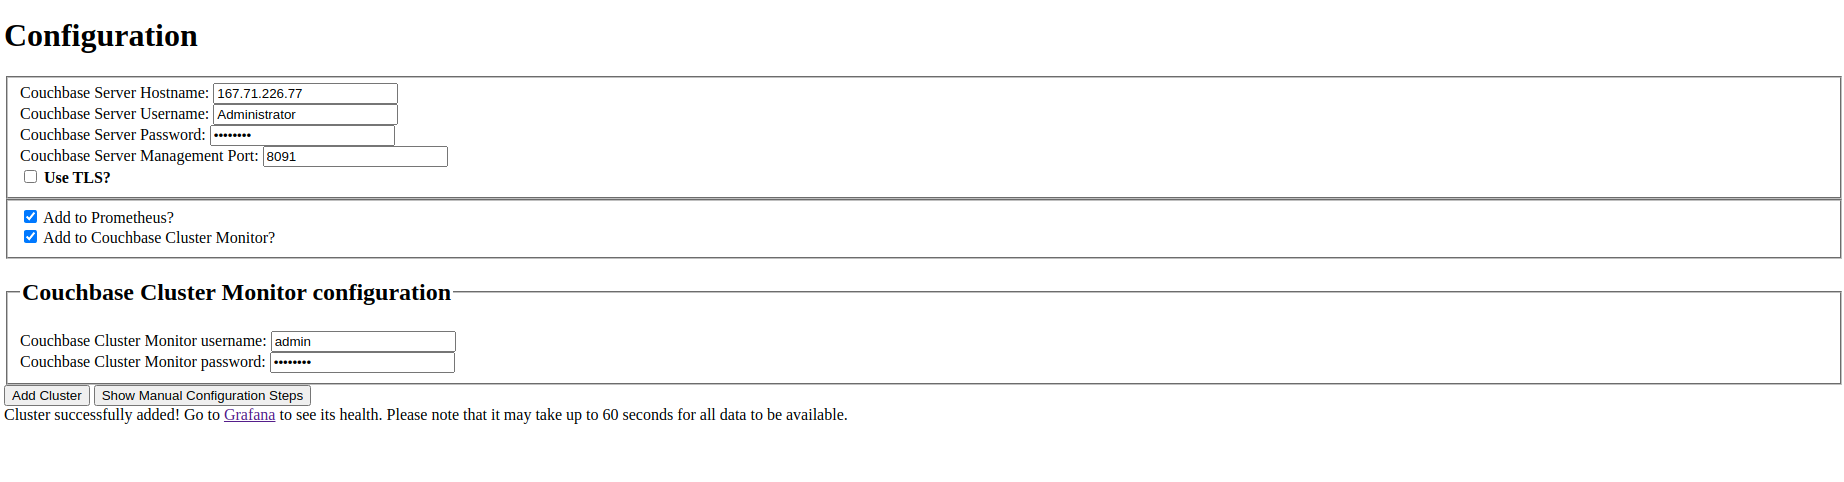
| This is a legacy way of configuring Prometheus targets and we recommend not to use this approach. You can use CMOS UI to perform the same using the "Add Cluster" option present on the landing page. |
The cluster monitor exposes a REST API endpoint from the container so that it can be used externally to add/remove Couchbase clusters.
The cluster monitor can be configured via a bespoke REST API: curl -u "${CLUSTER_MONITOR_USER}:${CLUSTER_MONITOR_PWD}" -X POST -d '{ "user": "'"${COUCHBASE_USER}"'", "password": "'"${COUCHBASE_PWD}"'", "host": "'"${COUCHBASE_ENDPOINT}"'" }' "${CLUSTER_MONITOR_ENDPOINT}/api/v1/clusters"
-
CLUSTER_MONITOR_USER=${CLUSTER_MONITOR_USER:-admin}: The username for the cluster monitor tool. -
CLUSTER_MONITOR_PWD=${CLUSTER_MONITOR_PWD:-password}: The password for the cluster monitor tool. -
CLUSTER_MONITOR_ENDPOINT=${CLUSTER_MONITOR_ENDPOINT:-http://localhost:8080/couchbase}: The endpoint of the cluster monitor tool. -
COUCHBASE_USER=${COUCHBASE_USER:-Administrator}: The username for accesing the Couchbase cluster. -
COUCHBASE_PWD=${COUCHBASE_PWD:-password}: The password for accesing the Couchbase cluster. -
COUCHBASE_ENDPOINT=${COUCHBASE_ENDPOINT:-http://db2:8091}: This should be set to a node that you want to monitor in a Couchbase cluster.
As an example to configure a new cluster node to be monitored:
CLUSTER_MONITOR_USER=admin
CLUSTER_MONITOR_PWD=password
CLUSTER_MONITOR_ENDPOINT=http://localhost:$(docker container port couchbase-grafana 7196)
COUCHBASE_USER=Administrator
COUCHBASE_PWD=password
COUCHBASE_ENDPOINT=http://db2:8091
curl -u "${CLUSTER_MONITOR_USER}:${CLUSTER_MONITOR_PWD}" -X POST -d '{ "user": "'"${COUCHBASE_USER}"'", "password": "'"${COUCHBASE_PWD}"'", "host": "'"${COUCHBASE_ENDPOINT}"'" }' "${CLUSTER_MONITOR_ENDPOINT}/api/v1/clusters"
Prometheus
Prometheus has various configuration options exposed to the user, almost entirely using files. You can mount these configuration files to the CMOS container using docker volumes or bind mounts.
To pick up any configuration changes after the Prometheus service has started, you may need to reload the config files using the reload endpoint.
|
Below are the environment variables used for Prometheus configuration. To read more about Prometheus configuration, see the official documentation website.
# Prometheus configuration file
PROMETHEUS_CONFIG_FILE=${PROMETHEUS_CONFIG_FILE:-/etc/prometheus/prometheus-runtime.yml}

# Prometheus configuration file template
PROMETHEUS_CONFIG_TEMPLATE_FILE=${PROMETHEUS_CONFIG_TEMPLATE_FILE:-/etc/prometheus/prometheus-template.yml}

# Prometheus url sub path
PROMETHEUS_URL_SUBPATH=${PROMETHEUS_URL_SUBPATH-/prometheus/}

# Prometheus storage path
PROMETHEUS_STORAGE_PATH=${PROMETHEUS_STORAGE_PATH-/prometheus}

# Microlith configuration
PROMETHEUS_DYNAMIC_INTERNAL_DIR=${PROMETHEUS_DYNAMIC_INTERNAL_DIR:-/etc/prometheus/couchbase/monitoring/}
Endpoints
In CMOS, a file-based service discovery approach is used to support adding/removing endpoints. These endpoints are used to dynamically scrape metrics.
Based on which services are enabled, the microlith will construct a set of dynamic endpoints.
These endpoints are created for each service by adding a JSON file to the ${PROMETHEUS_DYNAMIC_INTERNAL_DIR:-/etc/prometheus/couchbase/monitoring/}.
To add Couchbase Server endpoints, create a similar JSON format file like the example in the /etc/prometheus/couchbase/custom/ directory mounted on the container.
In order to always stay current with the system state, this file is periodically rescanned to add or remove targets.
[
    {
      "targets": [
        "exporter:9091"
      ],
      "labels": {
        "job": "db1",
        "container": "exporter"
      }
    }
]
You can set the authentication credentials for your Couchbase Server clusters using the $CB_SERVER_AUTH_USER and $CB_SERVER_AUTH_PASSWORD environment variables.
Note that currently we do not support using different credentials for multiple clusters.
Loki
Configuration file for the log aggregation system Loki is present in the YAML file located at /etc/loki/config.yaml inside the container.
You can update the environment variable to change the location of the config file or update the config file to change the properties of Loki accordingly.
# Loki configuration
LOKI_CONFIG_FILE=${LOKI_CONFIG_FILE:-/etc/loki/config.yml}
Grafana
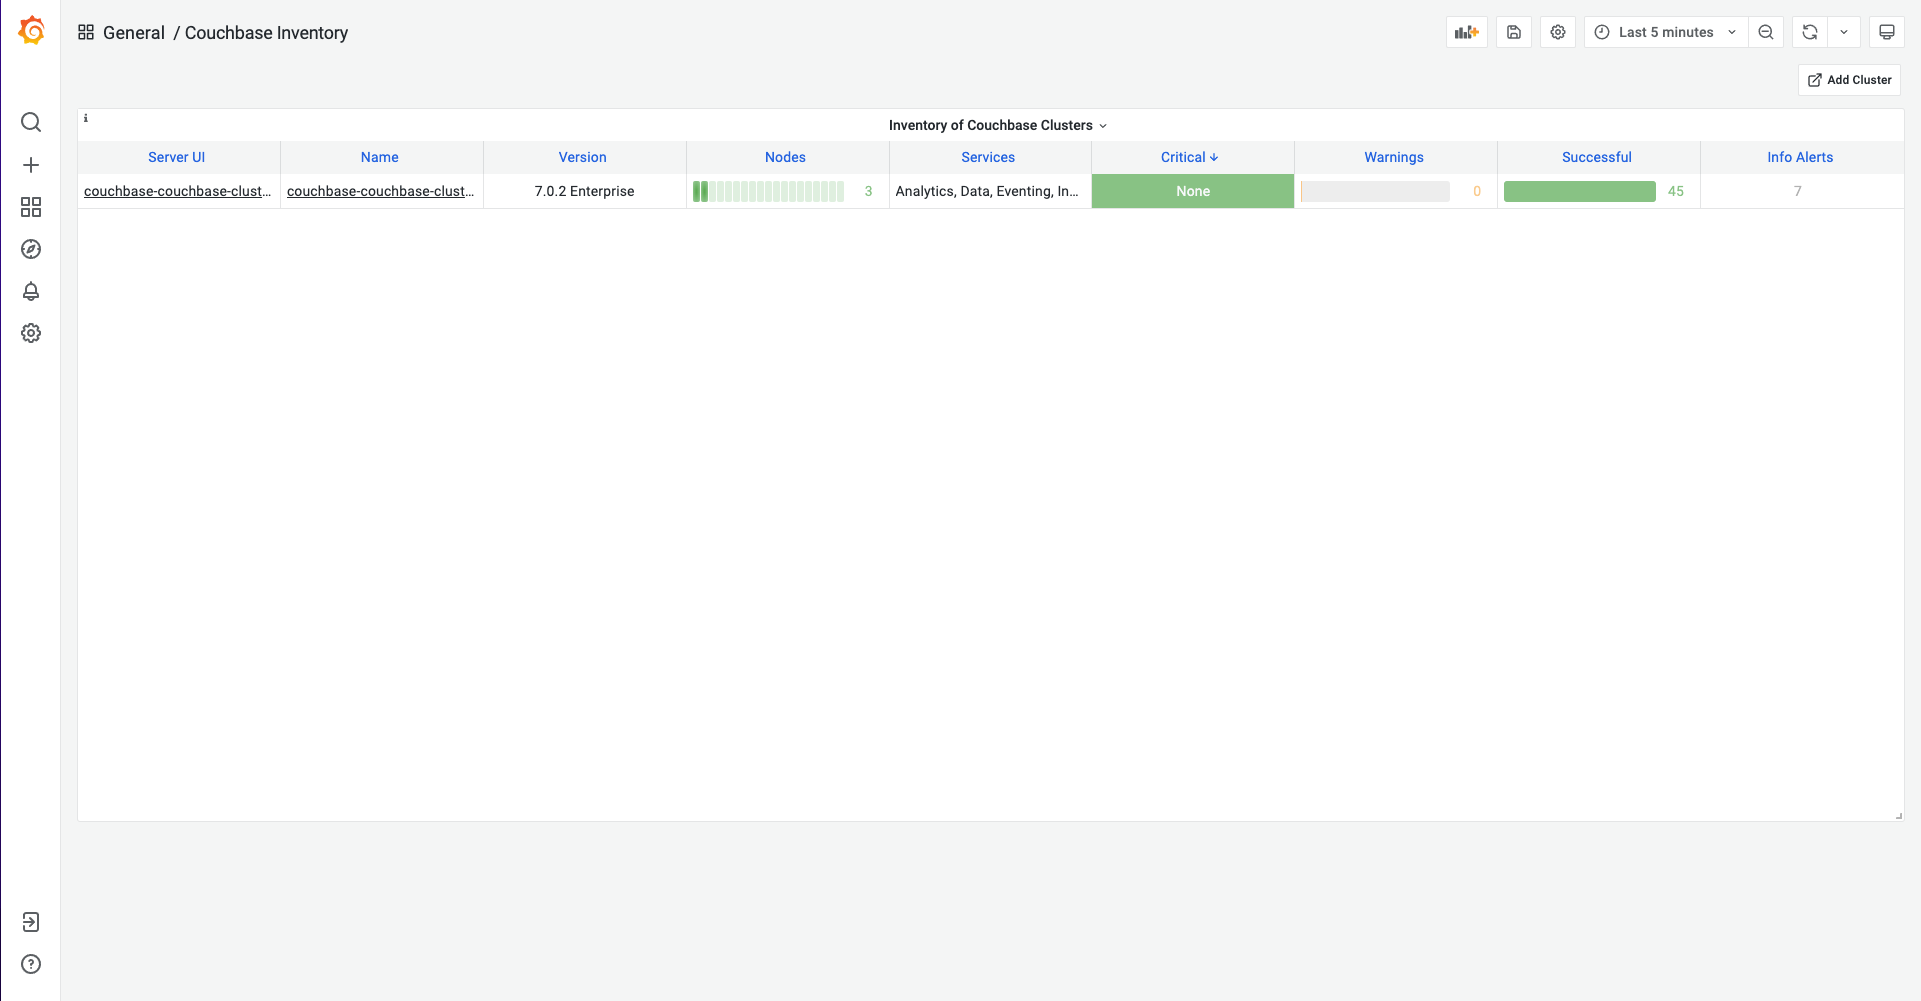
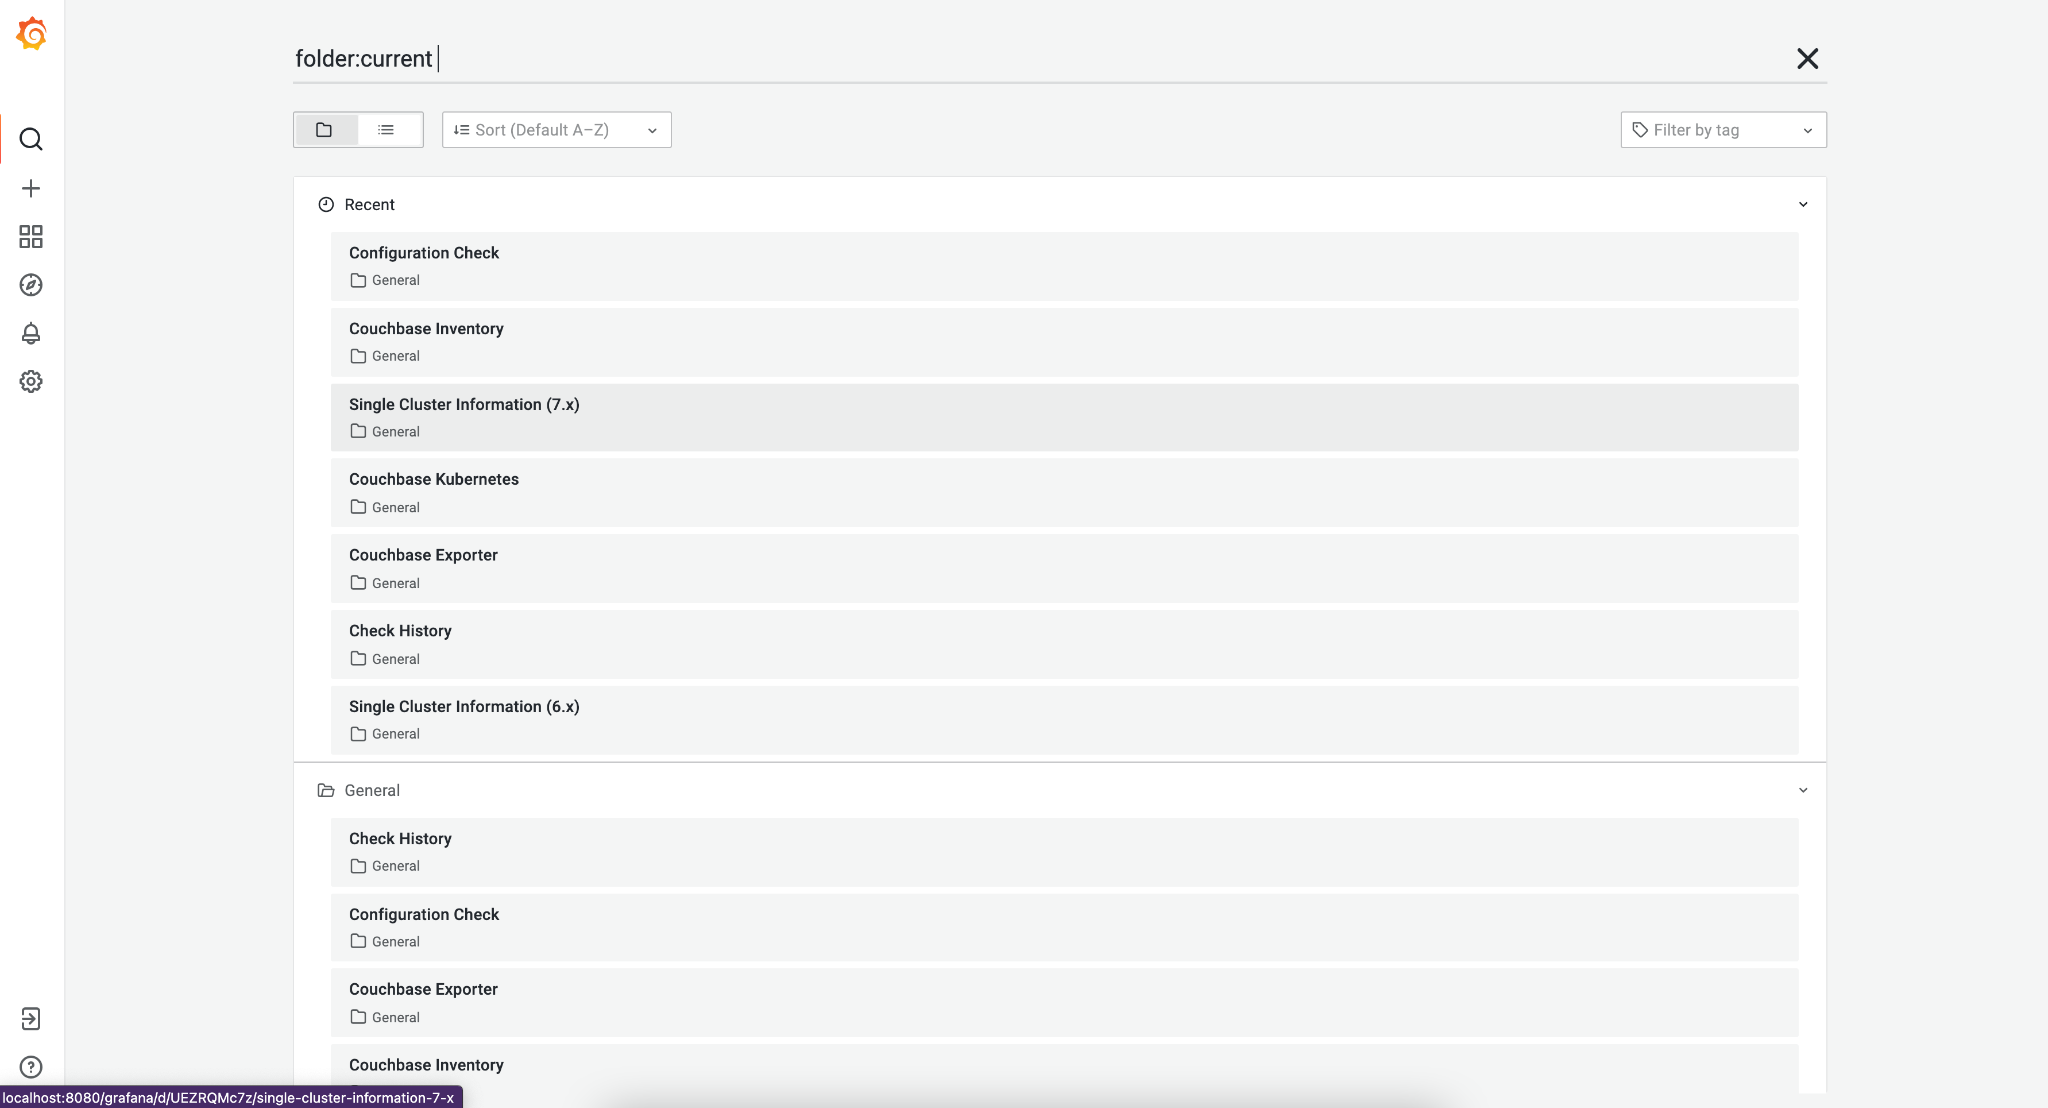
Various dashboards to monitor the Couchbase cluster are shipped out of the box in Grafana. You can list all the dashboards using the search dashboard option. You may also create additional dashboards that meet your needs. Post successful completion of the setup steps previously described, you should be able to see a list of attached clusters in the Grafana landing page.
You can list all available dashboards by clicking on the search button. It will show a list of dashboards similar to the one below. You can navigate to each dashboard by clicking on the name.
Alert
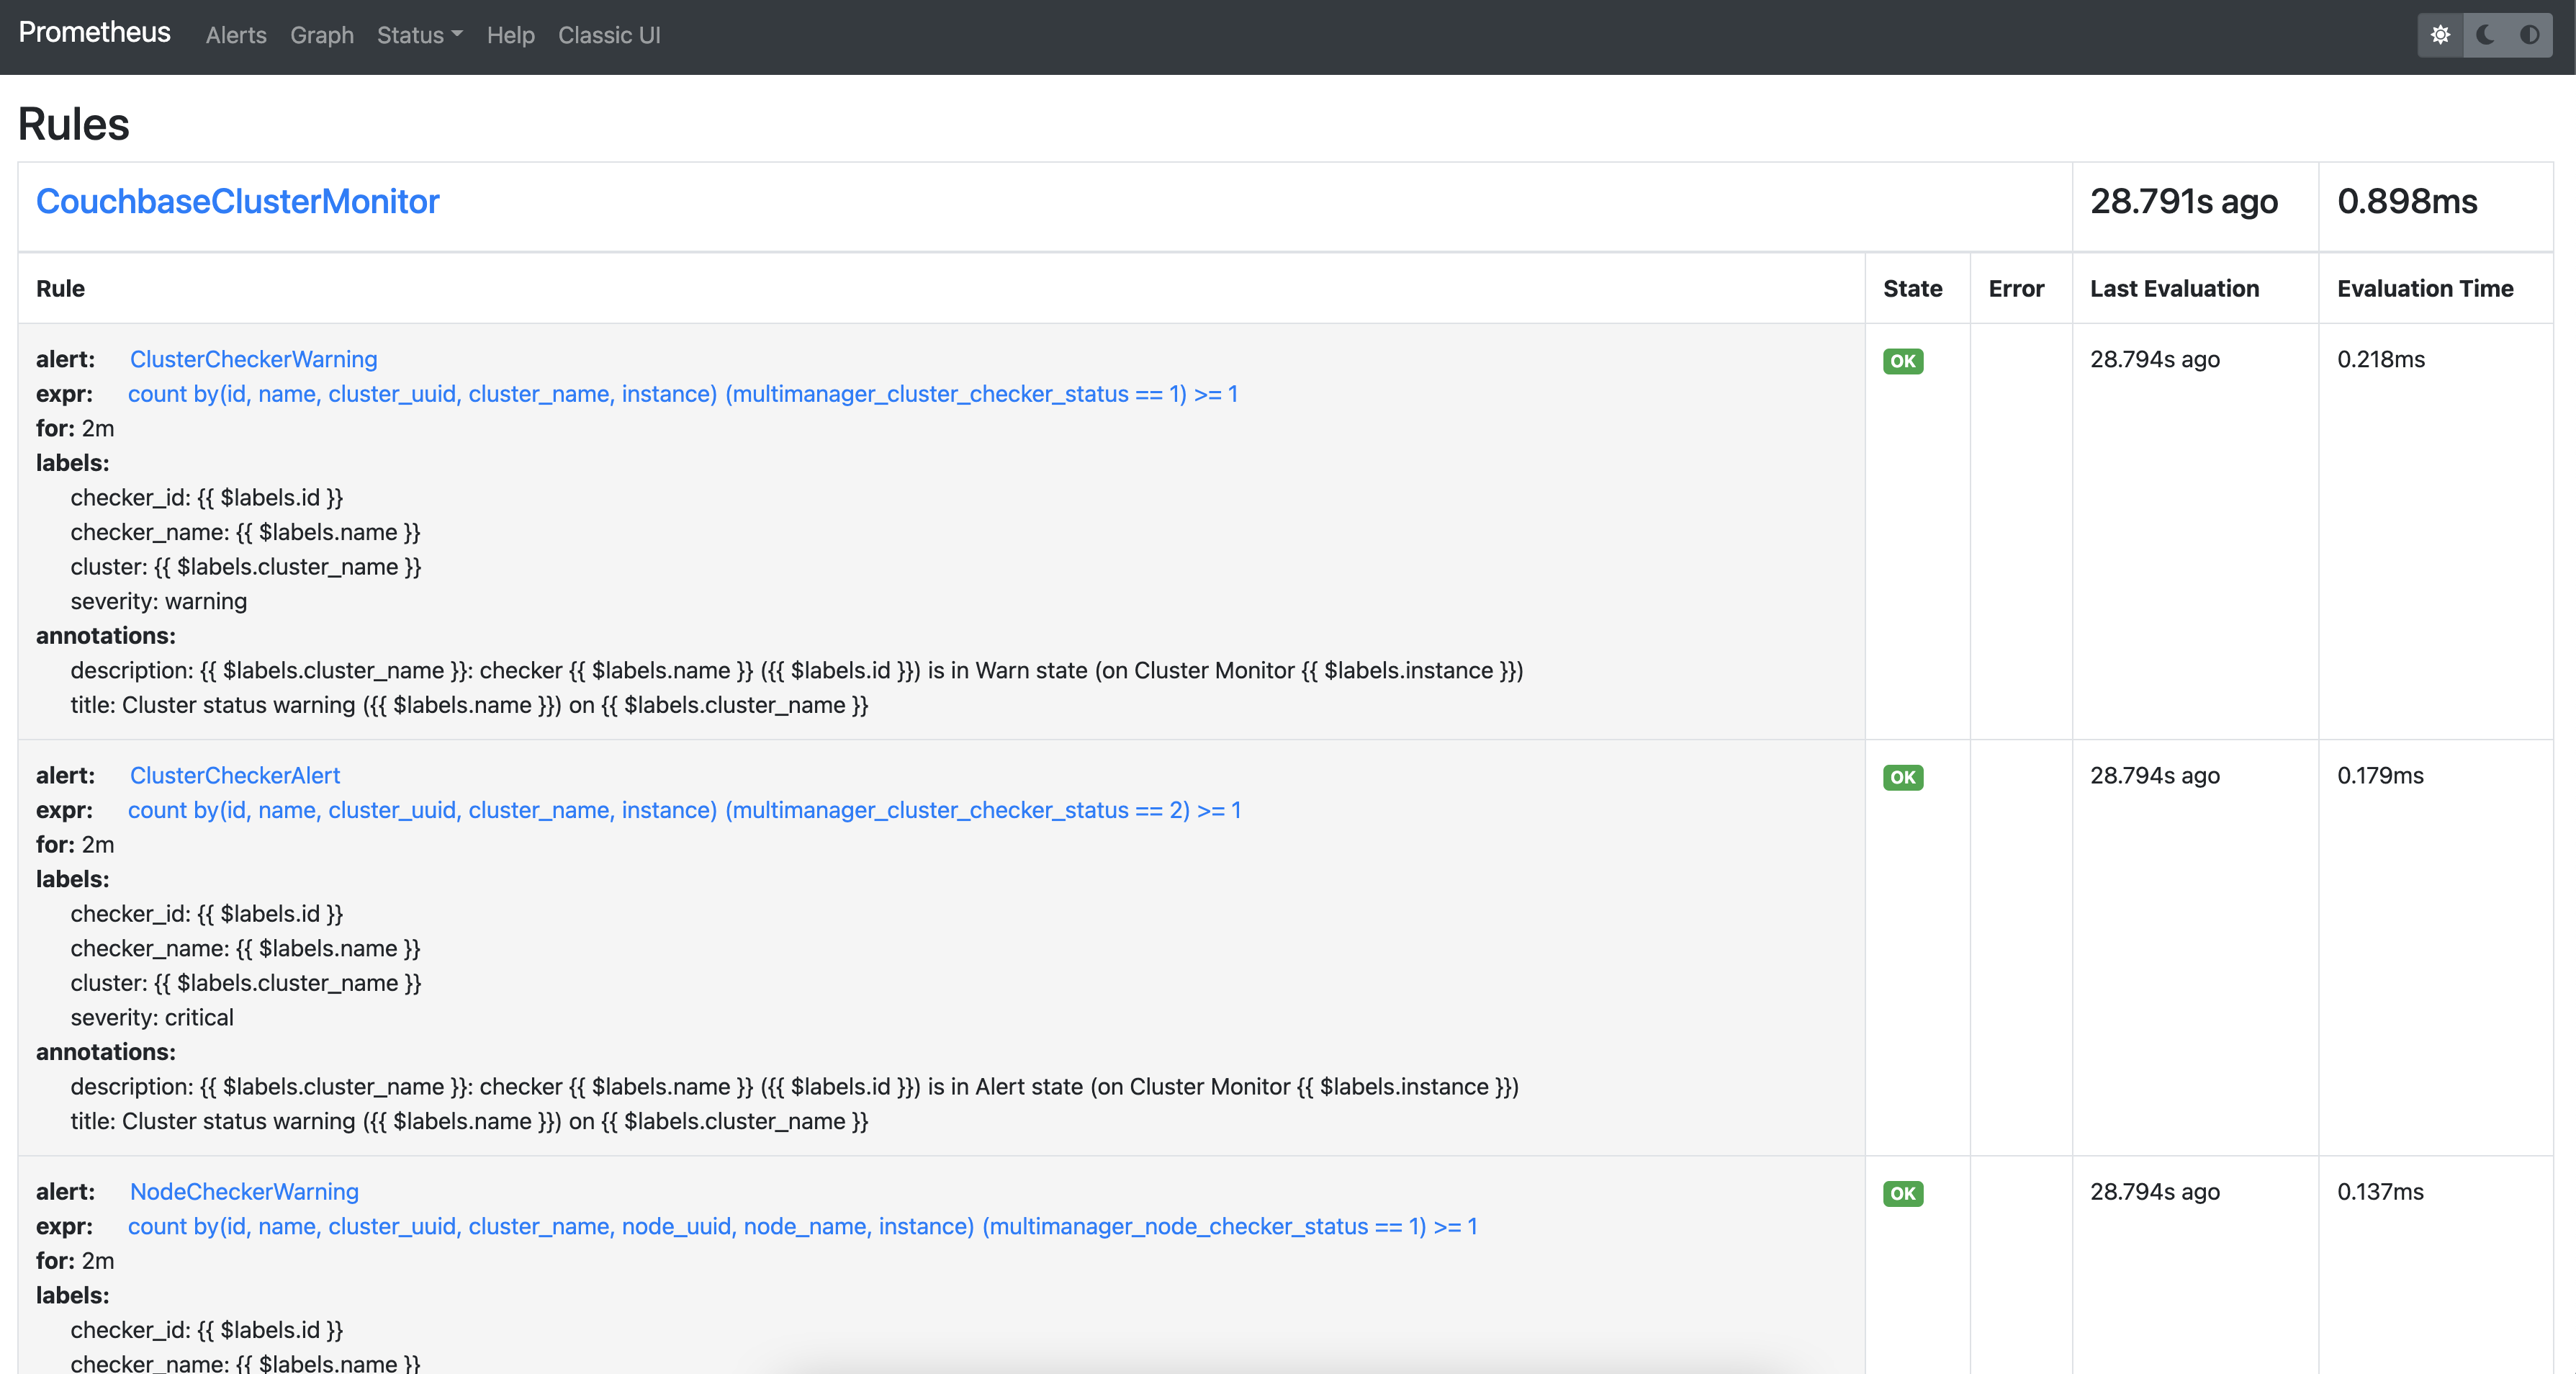
Alerting rules
Using alert rules, you can define alert conditions based on Prometheus language expressions and send notification to an external service when an alert is fired.
The installation of CMOS comes with default alerting rules located in the /etc/prometheus/alerting/couchbase/ directory.
| The default rules are not intended to be modified by the user. Changing the default rules could result in unexpected and unwanted behavior, so it should be avoided. |
To add custom alerts, you can place your custom alert rules file to /etc/prometheus/alerting/custom/ directory.
Using prometheus-alert-overrider, you can also override or disable a rule by putting it in the /etc/prometheus/alerting/overrides/ directory.
Below is an example of how to override a base rule.
# this is a base rule
groups:
    - name: Kubernetes-Monitoring
      rules:
# Node {{ $labels.node }} has been unready for a long time
          - alert: KubernetesNodeReady
            expr: kube_node_status_condition{condition="Ready",status="true"} == 0
            for: 10m
            labels:
                severity: critical
            annotations:
                summary: Kubernetes Node ready (instance {{ $labels.instance }})
                description: "Node {{ $labels.node }} has been unready for a long time\n  VALUE = {{ $value }}\n  LABELS = {{ $labels }}"
# override KubernetesNodeReady alert rule
groups:
    - name: Override
      rules:
          - alert: alert_override
            # list of rules to be overridden, accepts regexp
            override: ["KubernetesNodeReady"]
            # if set to false, only base rules are changed and no new rules
            # are created
            enabled: false
            # this expression will be negated and inserted into all rules
            # matching the values in override.
            expr: '{kubernetes_cluster="kube-dev"}'
            for: 30s
            labels:
                severity: warning
            annotations:
                summary: override kubernetes single alert
                description: "Node {{ $labels.node }} has been unready for a long time\n  VALUE = {{ $value }}\n  LABELS = {{ $labels }}"
We support modifying rules via environment variables. Prometheus automatically replaces template values in rules files with values based on available environment variables. You can see available environment variables in the entrypoint of prometheus service.
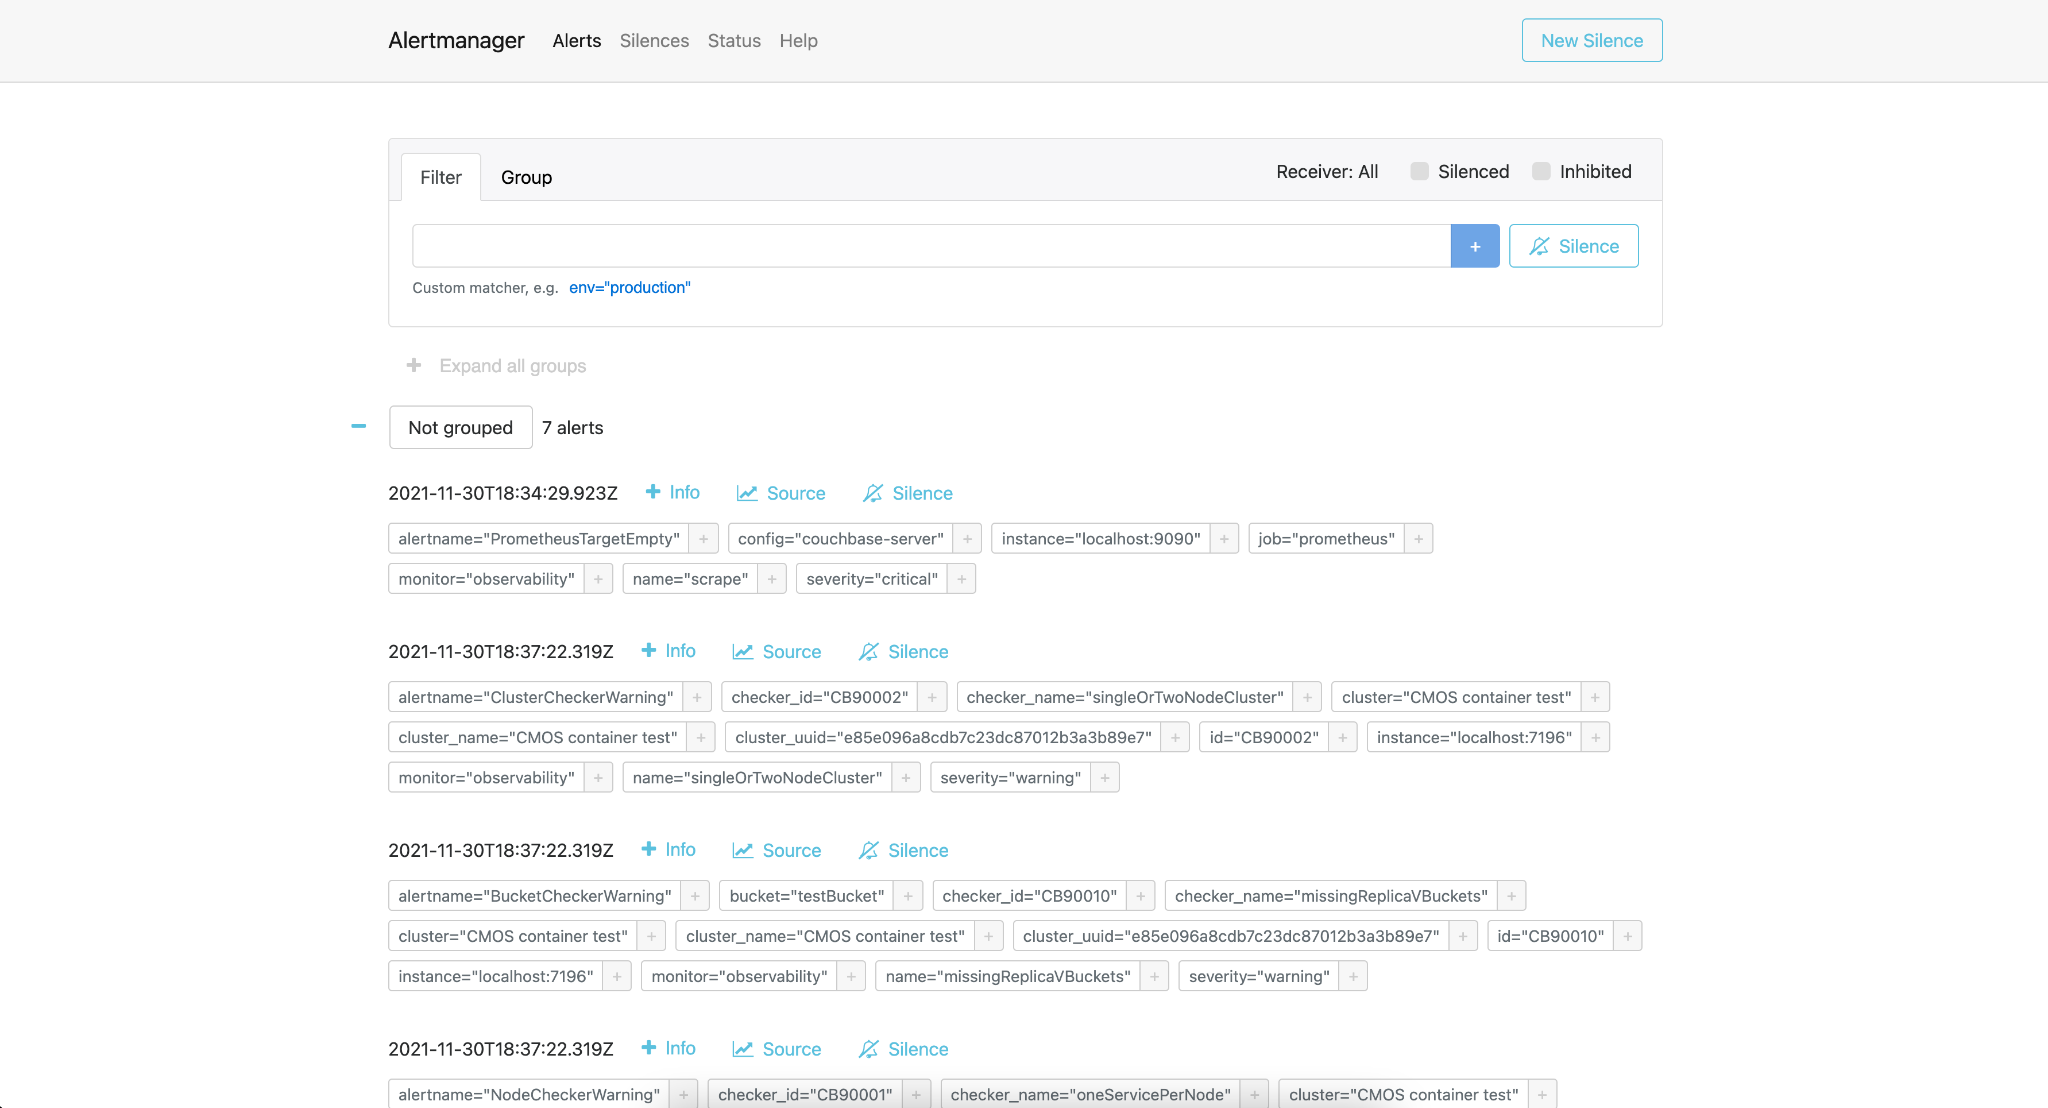
Alertmanager
By default the CMOS Alertmanager is enabled and Prometheus forwards the alerts to it.
Additional alert managers can be specified by using the same <file_sd_config> syntax in the /etc/prometheus/alertmanager/custom/ directory.
Here are the environment variables used for Alertmanager configuration.
# Alert manager configuration file
ALERTMANAGER_CONFIG_FILE=${ALERTMANAGER_CONFIG_FILE:-/etc/alertmanager/config.yml}

# Alert manager storage path
ALERTMANAGER_STORAGE_PATH=${ALERTMANAGER_STORAGE_PATH:-/alertmanager}
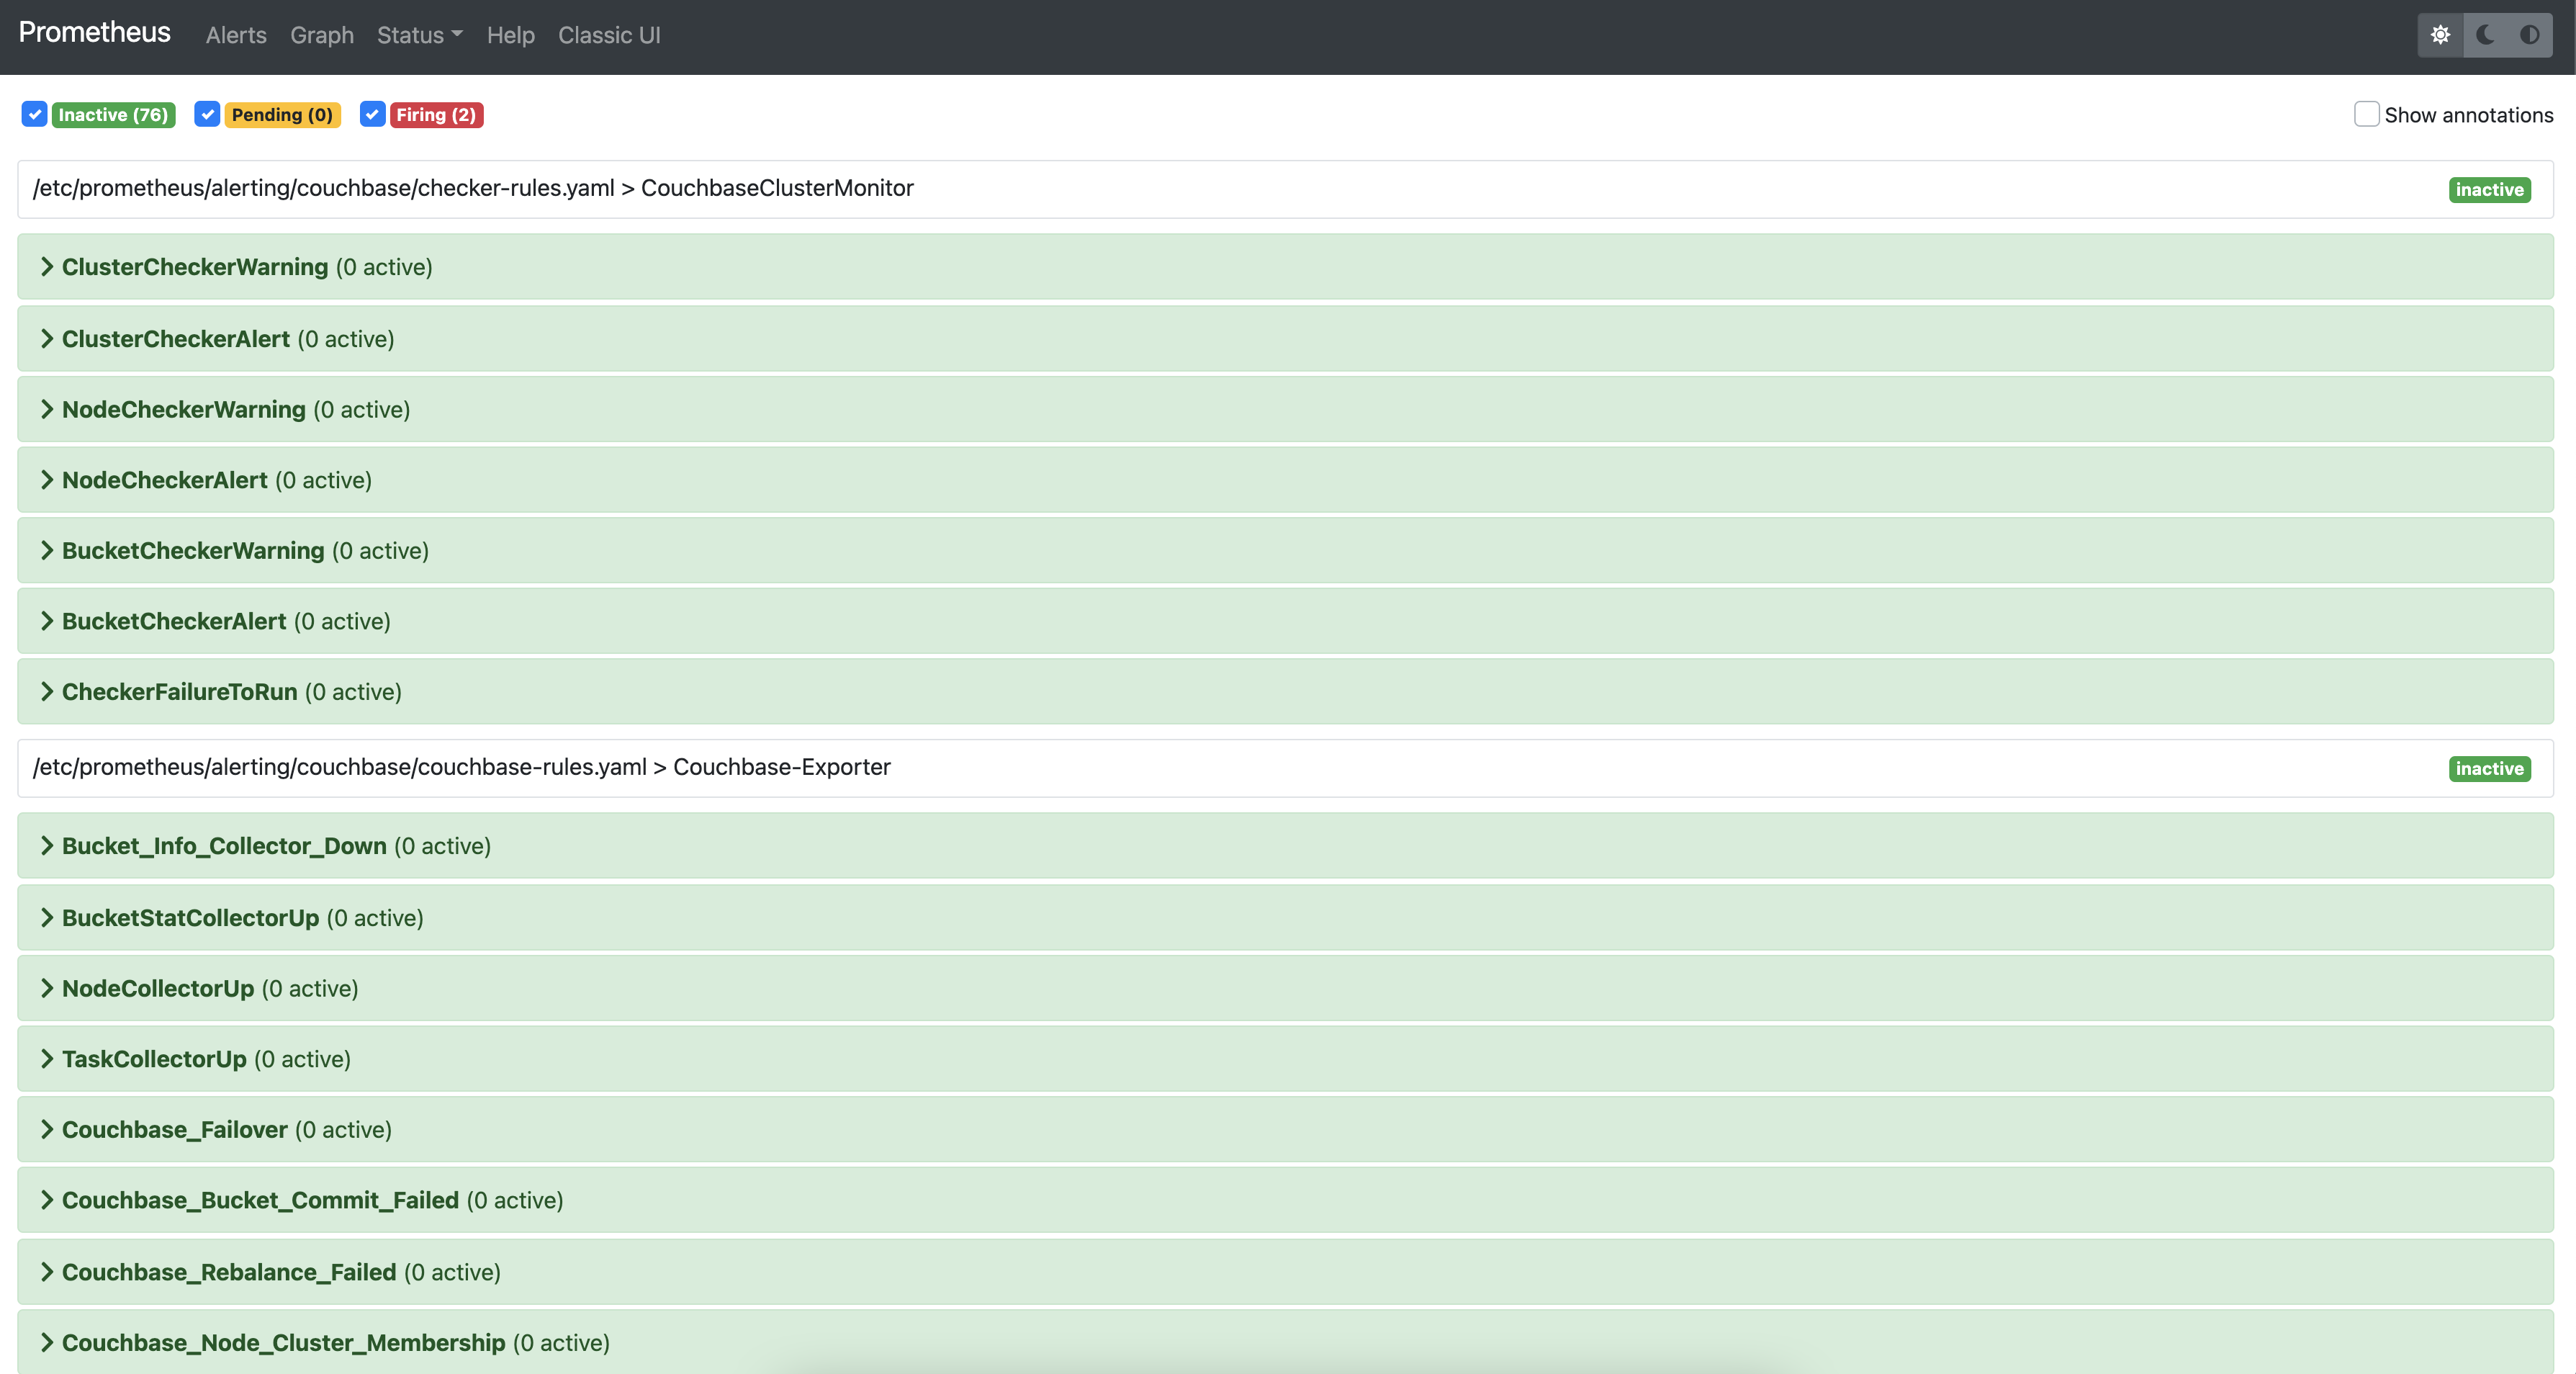
After the setup is complete, you can view the alerts and alert rules in the dashboard by navigating to the Alertmanager page from the landing page. To configure Alertmanager to send notifications to your desired receiver, you can follow the standard approach suggested by Alertmanager.