Using the Couchbase Tableau Connector
- how-to
Set up a connection between Tableau and your Couchbase data source using the Couchbase Tableau Connector.
Configure Connection
To set up a connection between Tableau and your Couchbase data source:
-
Open Tableau Desktop.
-
Go to .
-
Select a Couchbase Tableau Connector. If there are multiple connectors installed, select the one that is compatible with your Couchbase data source.
-
In the connection dialog, enter the following details:
Server The host and port details. The default HTTP port is
8095, while the default HTTPS/TLS port is18095.Scope (Optional) The scope to extract data from. You can leave this field blank or use
Defaultif your data is in the default scope.Authentication The authentication method to use for the connection.
Based on the authentication method you select, the required fields differ.
Authentication Method Required Fields Description Username and Password
Username, Password
Enter user credentials.
LDAP
Username, Password
Enter LDAP credentials.
Client Certificate
Client Certificate
Select the client certificate mode. You can select either
PEM Files (Certificate + Key)orKeystore (JKS/PKCS12). -
(Optional) Select the Require SSL option, if required.
To set up SSL support, see:
-
For advanced settings, click the Advanced tab. You can set the connection timeout and scan consistency mode. If you set the scan consistency to
Request plus, a dropdown appears to select the scan wait time. -
Click Sign In.
Set Up SSL Support for Tableau Connector
To set up SSL support for Tableau Connector, see the following sections:
Configure Advanced Settings
To set up the connection timeout and the scan consistency mode, go to the Advanced tab.
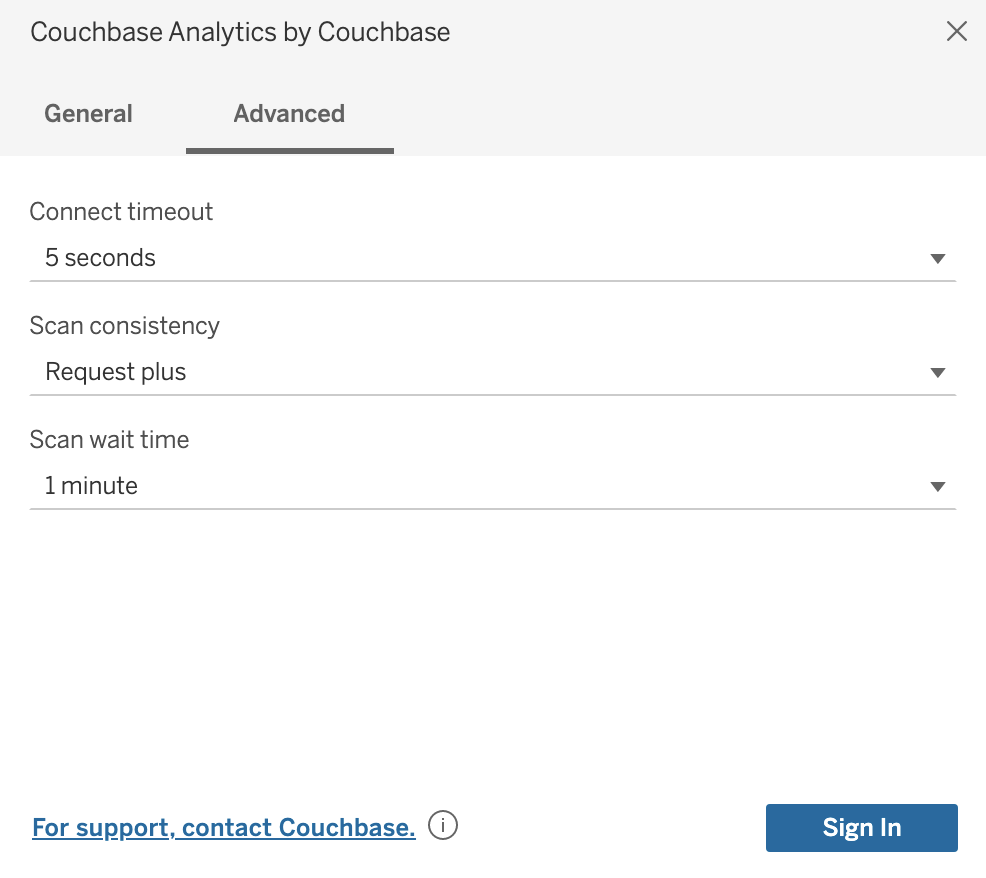
Setting the scan consistency to Request plus displays a dropdown to select the scan wait time.
Configure Tableau Server Connection on Tableau Desktop
Reports and dashboards created on Tableau Desktop can be published and viewed on Tableau Server. To configure your Tableau Server connection, go to .
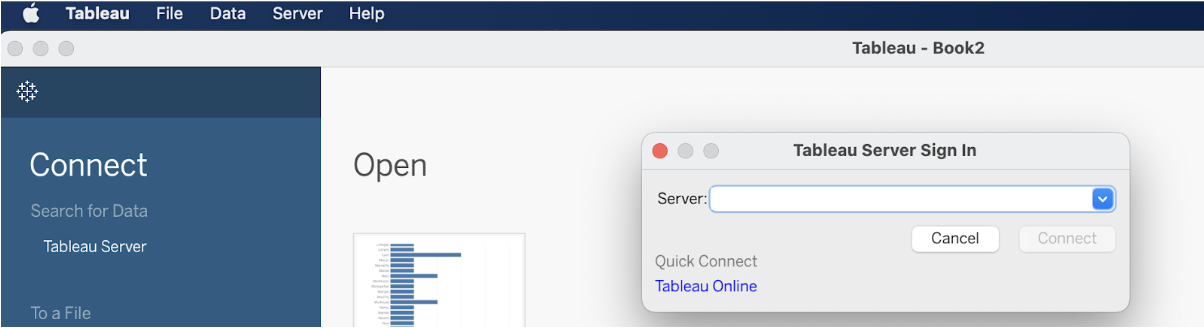
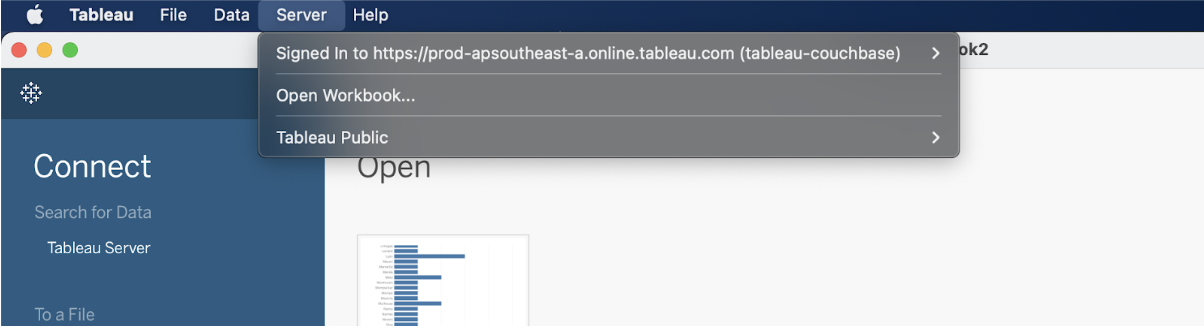
You will then be prompted to sign in to your Tableau Server account. Once signed in, you should see the connection in the Server section.
| If you’re using an on-premise instance of Tableau Server, you will need to configure SSL. This can be done by logging into the Tableau Services Manager UI and going to . |
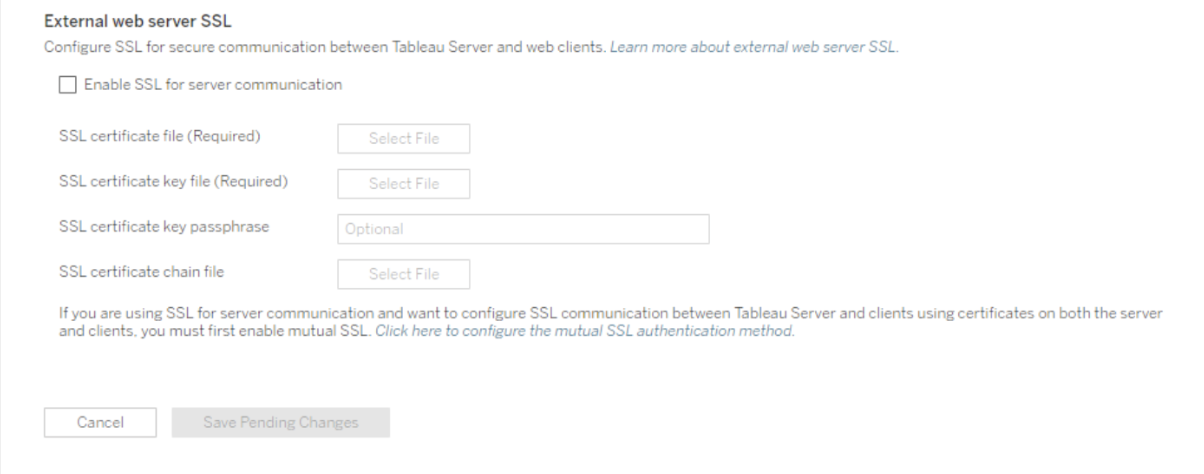
For more information on configuring SSL on your Tableau Server, follow the guide on the Configuring SSL on Tableau Server page.
View Data from Analytic Views on Tableau
Once Tableau has successfully established a connection with your Couchbase Server, you should see it in the Connections section. You should also see the Analytics scopes set up in the previous steps.
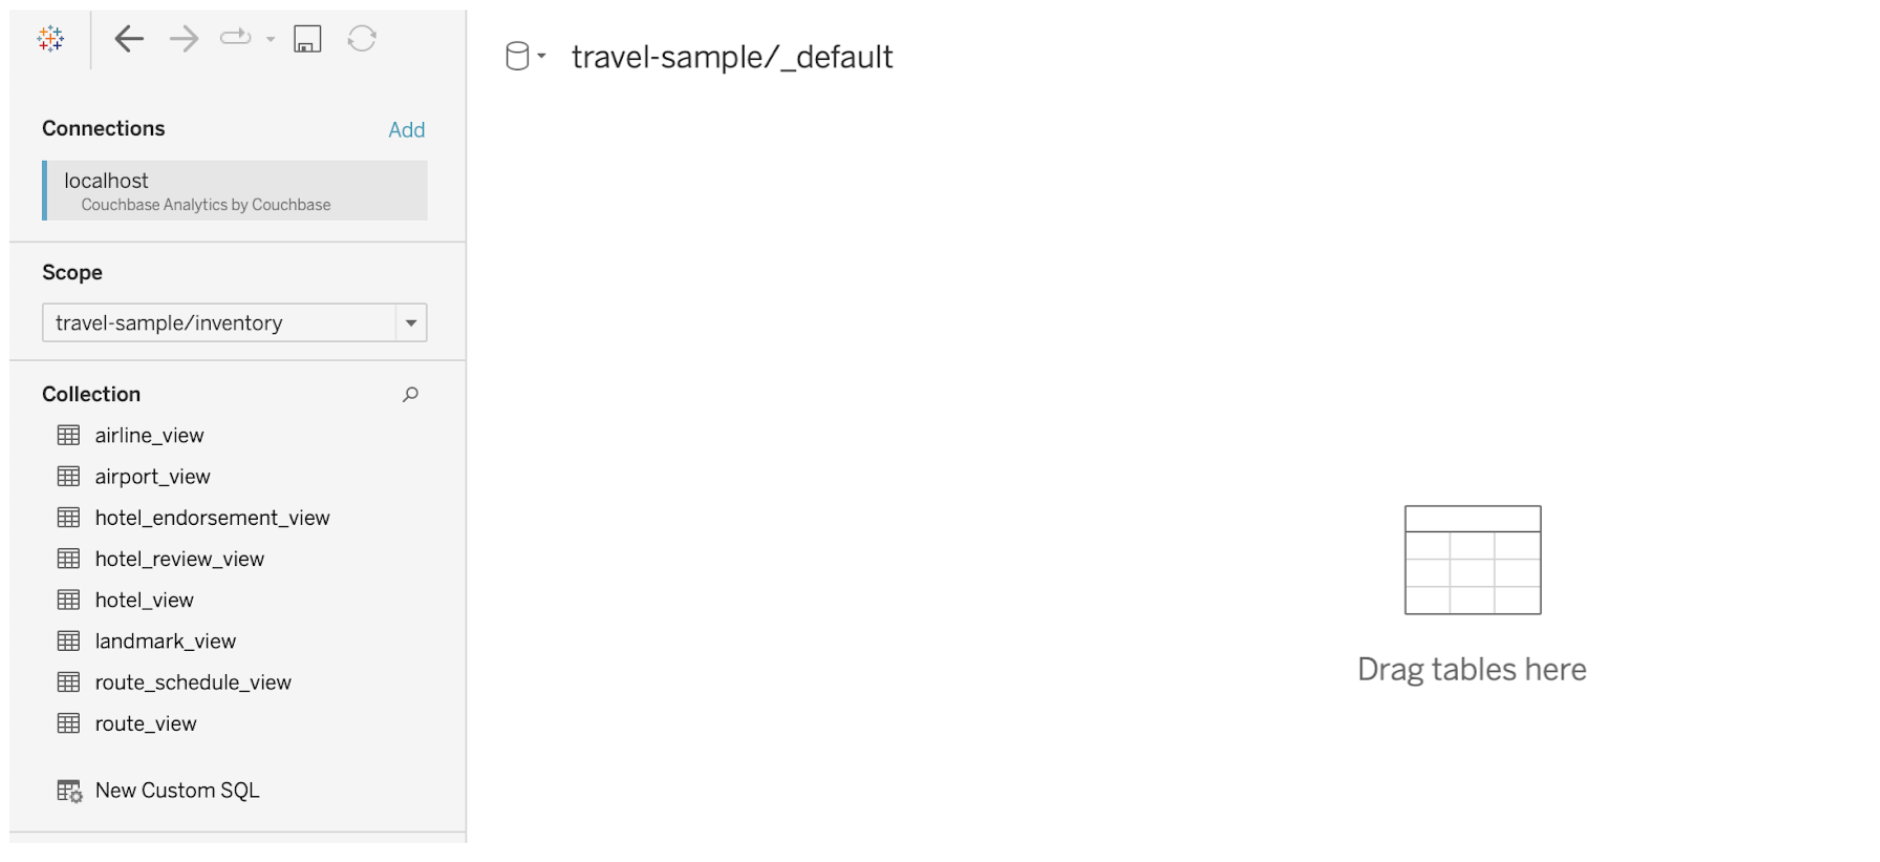
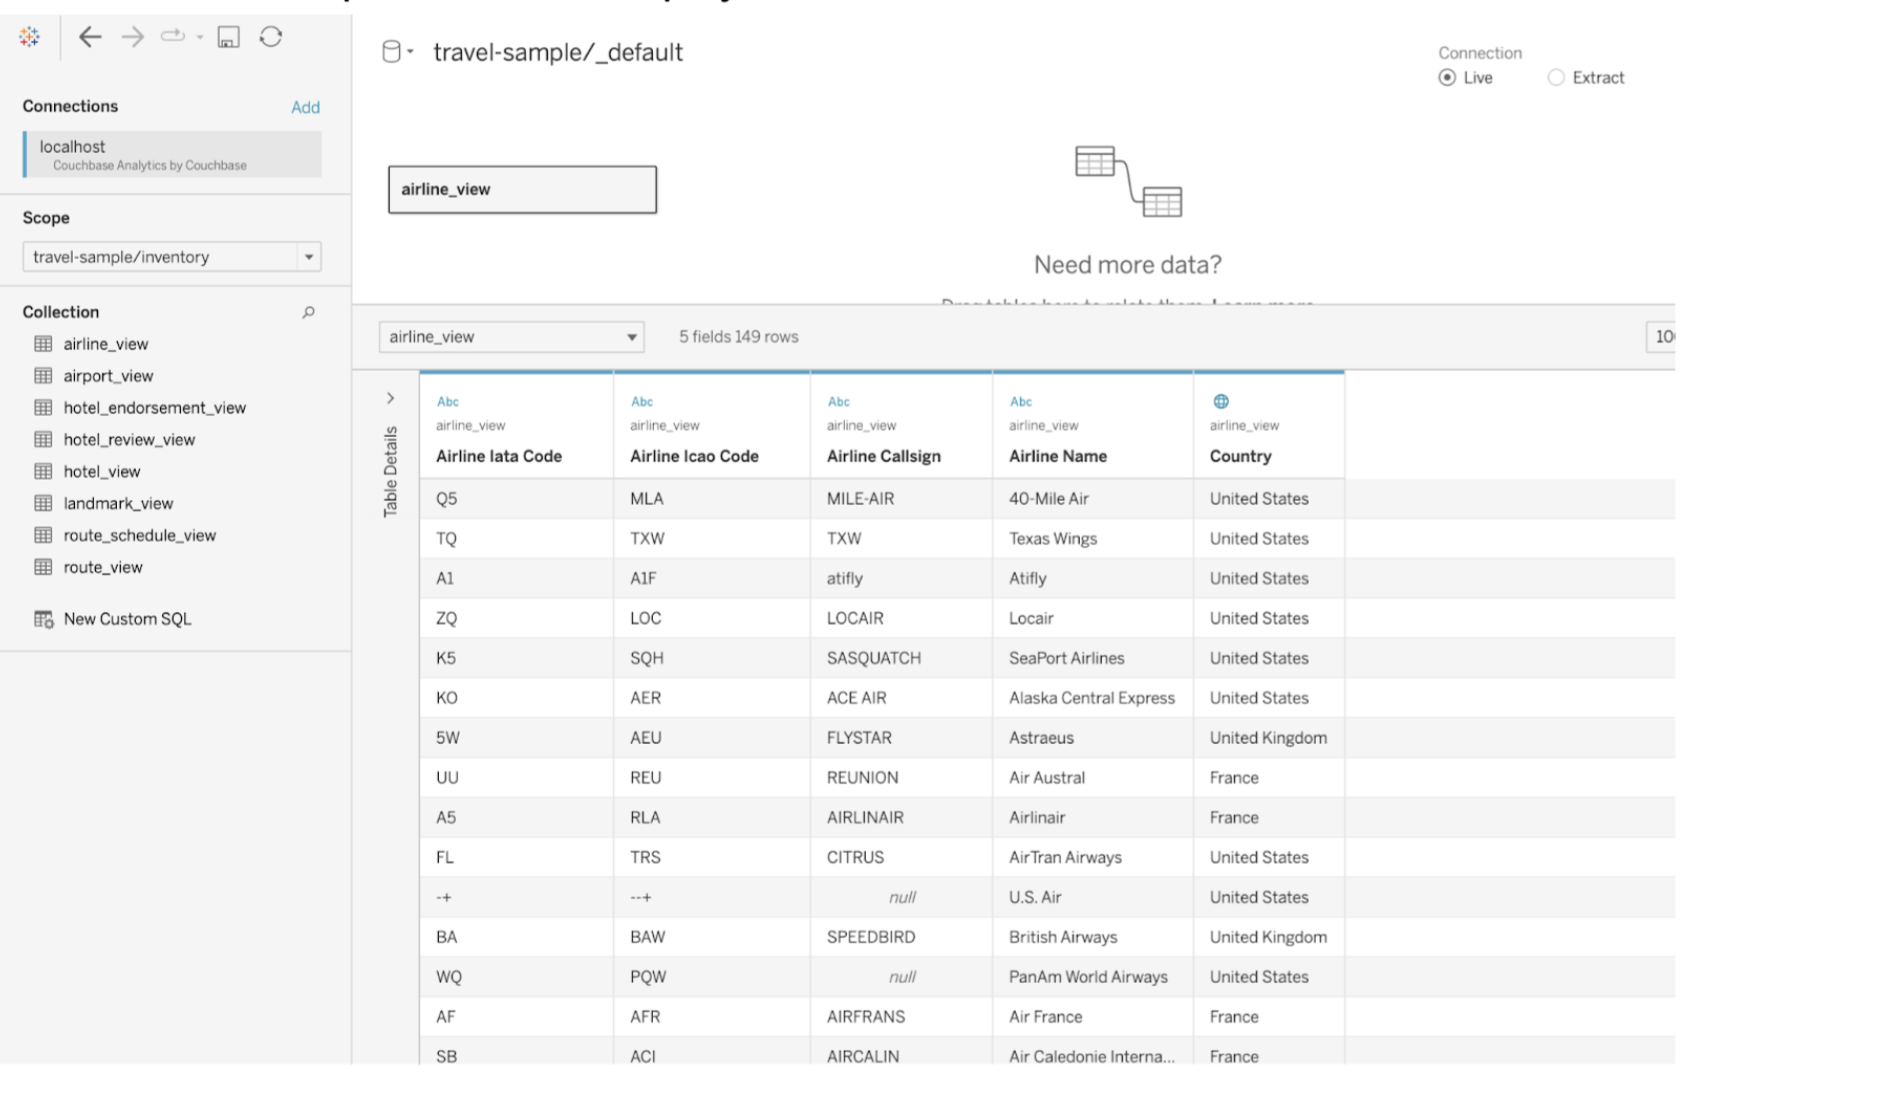
The collections are listed based on the tabular views created. Dragging and dropping a view onto the data pane will then display the data for the view in a table.
Use Couchbase Analytics Views to Build Tableau Worksheets
Now that you have your Couchbase Analytics Tabular views set up on Tableau, you can now use these views as the data source to build your Tableau worksheets.
From the Data Source pane, drag and drop the airline_view onto the data pane. This will bring up two views. The first view shows you details about the view including the mapping from the view column names to their corresponding document fields.
Next select Sheet1, which should now show the individual columns from the view along with a subset of the columns called Measure Values.
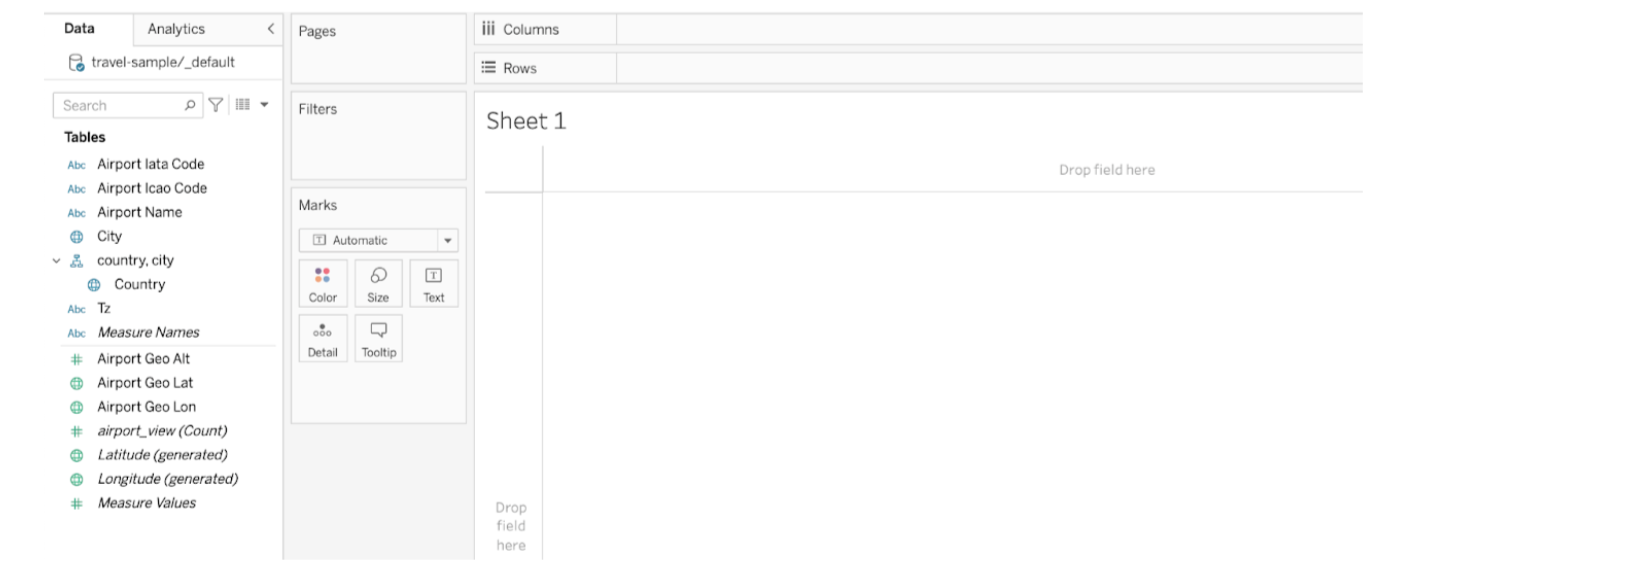
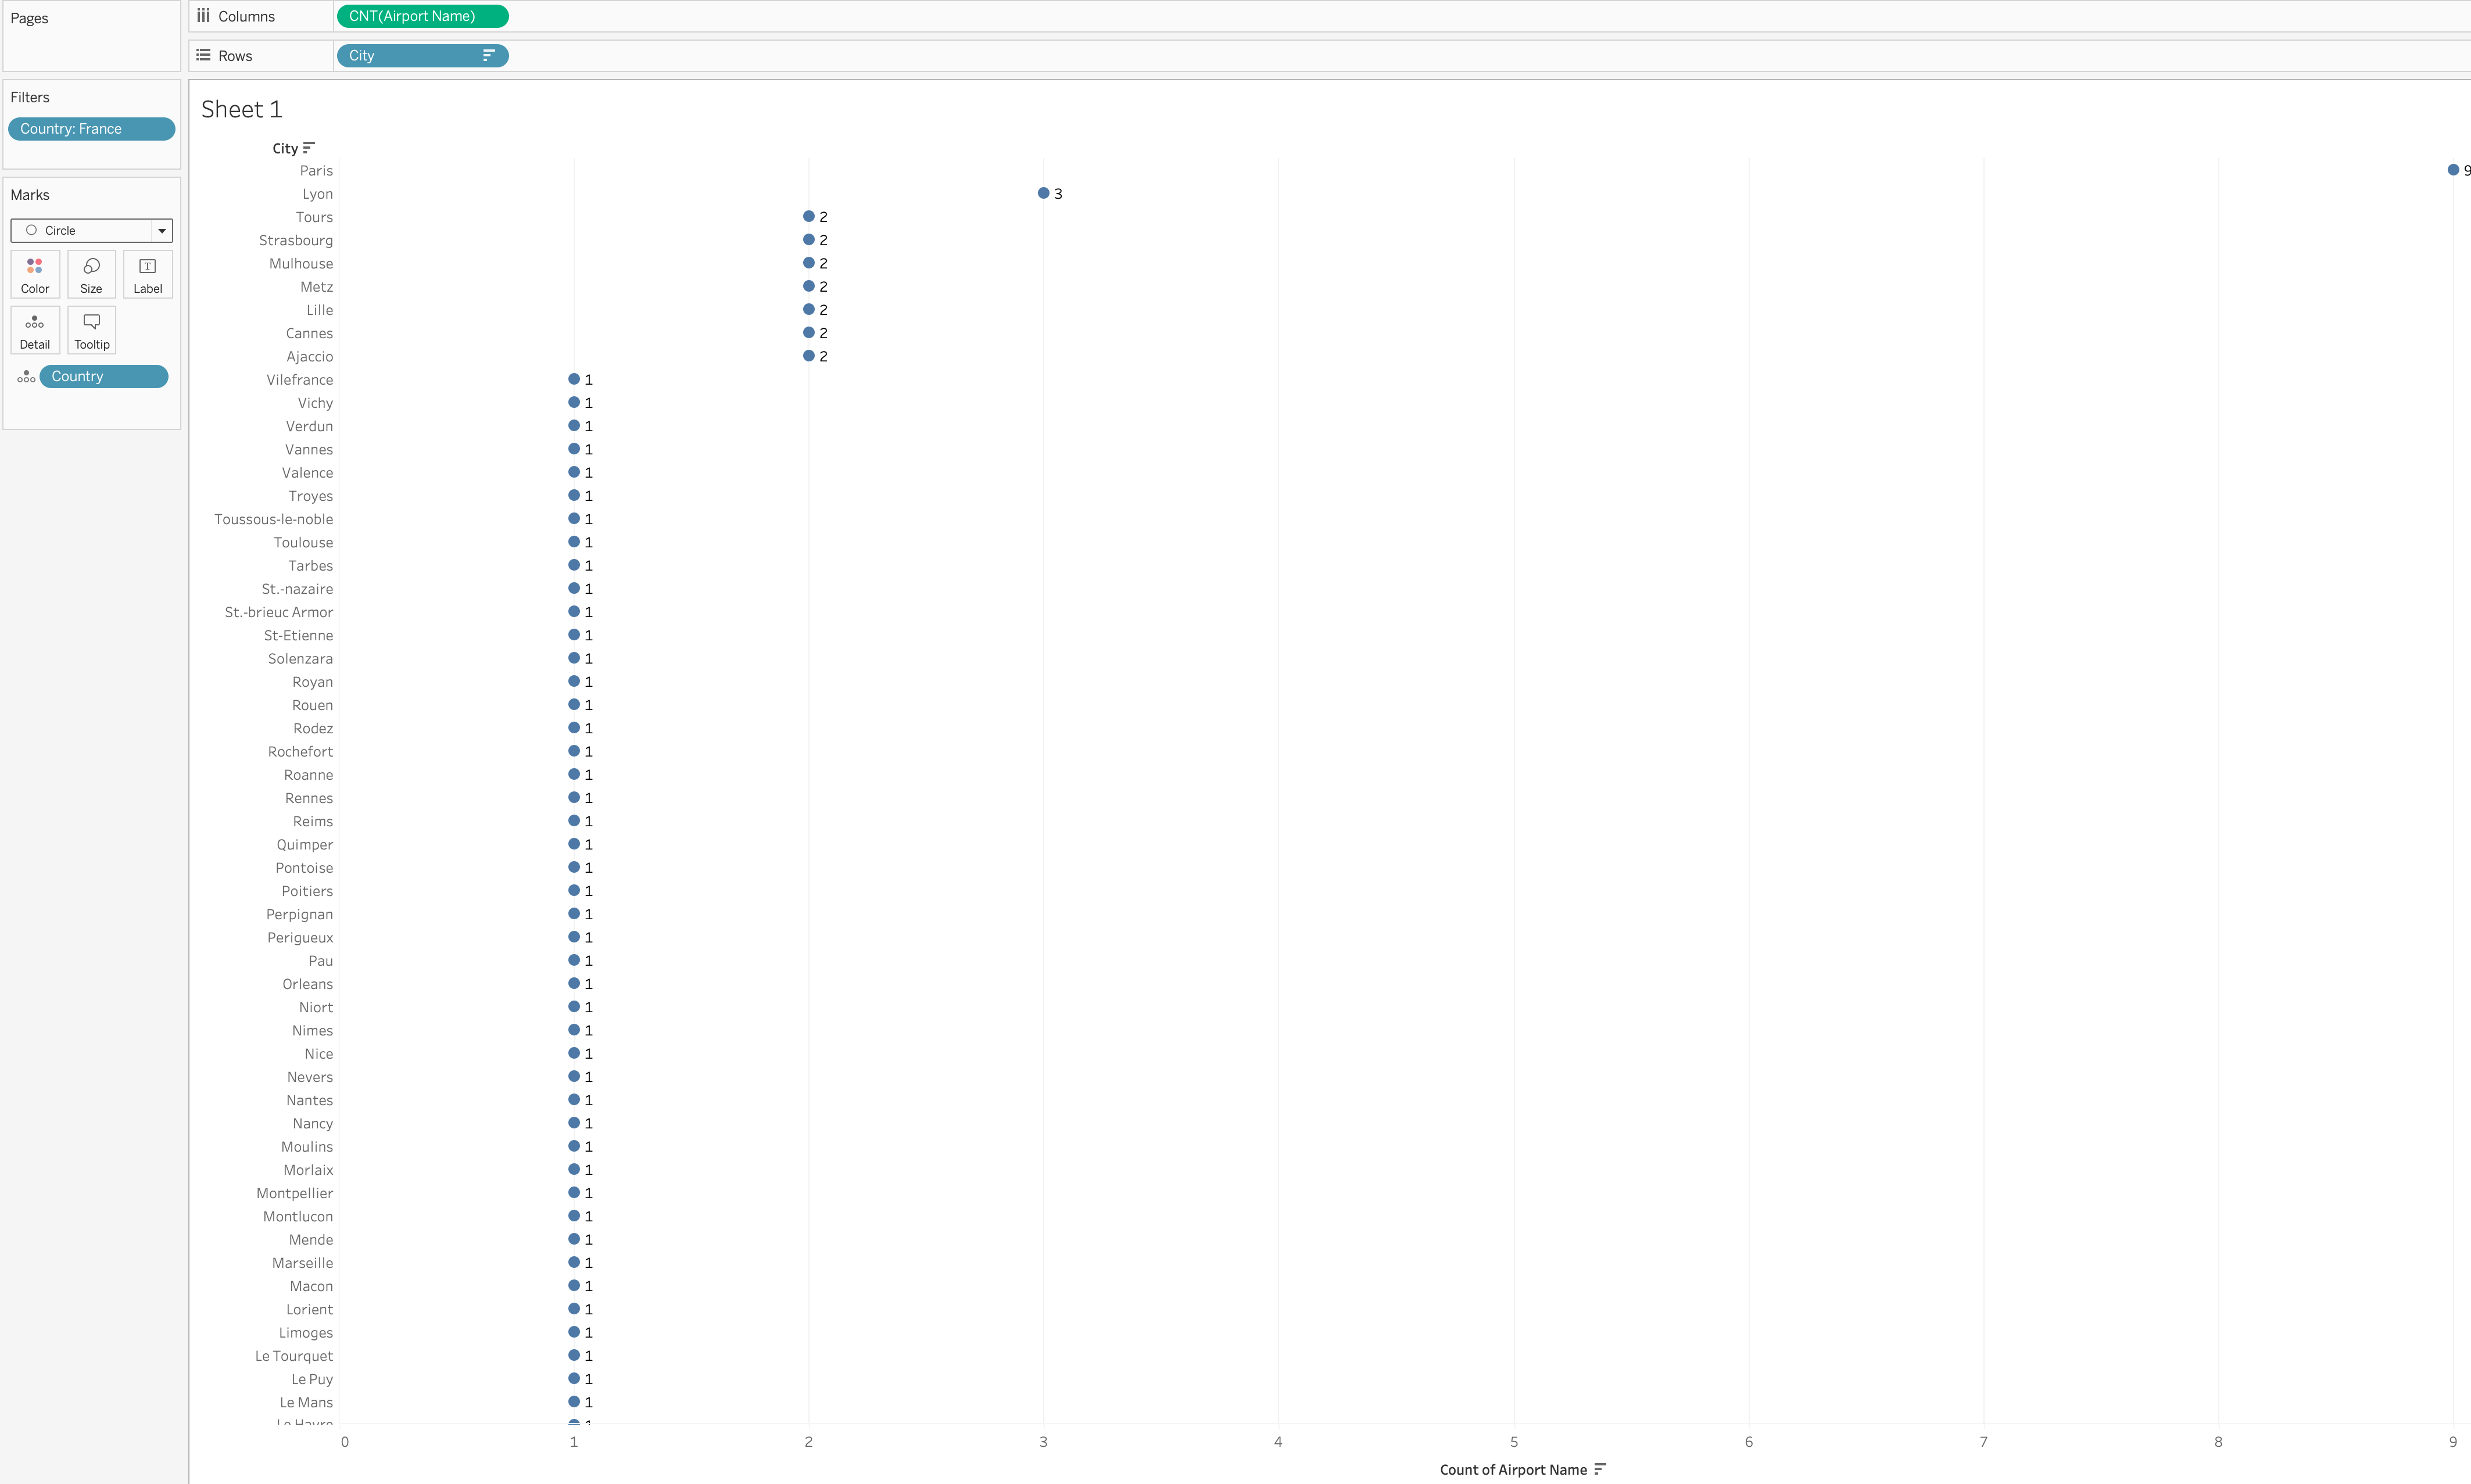
Drag the City column on to the Rows section to add cities to the sheet. Next, add Airport Name to the columns section. Select the drop-down and choose .
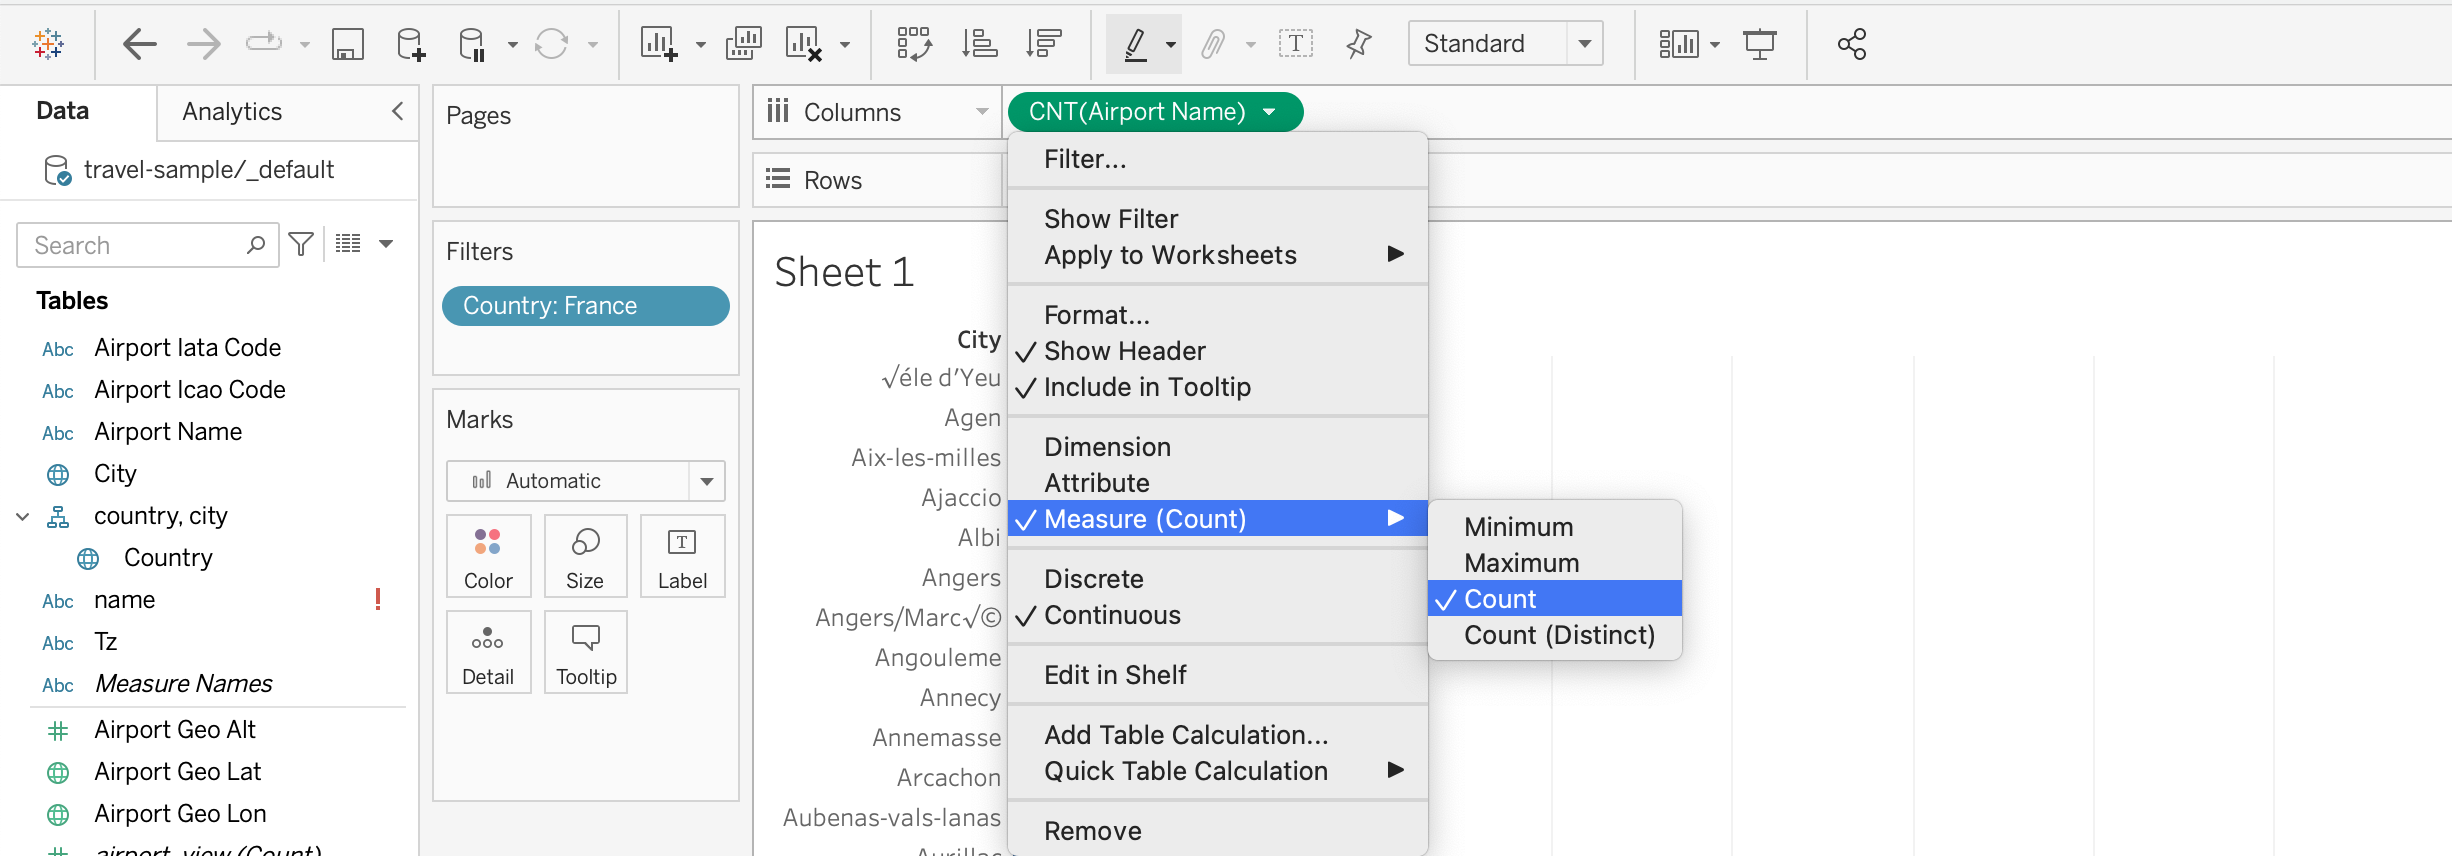
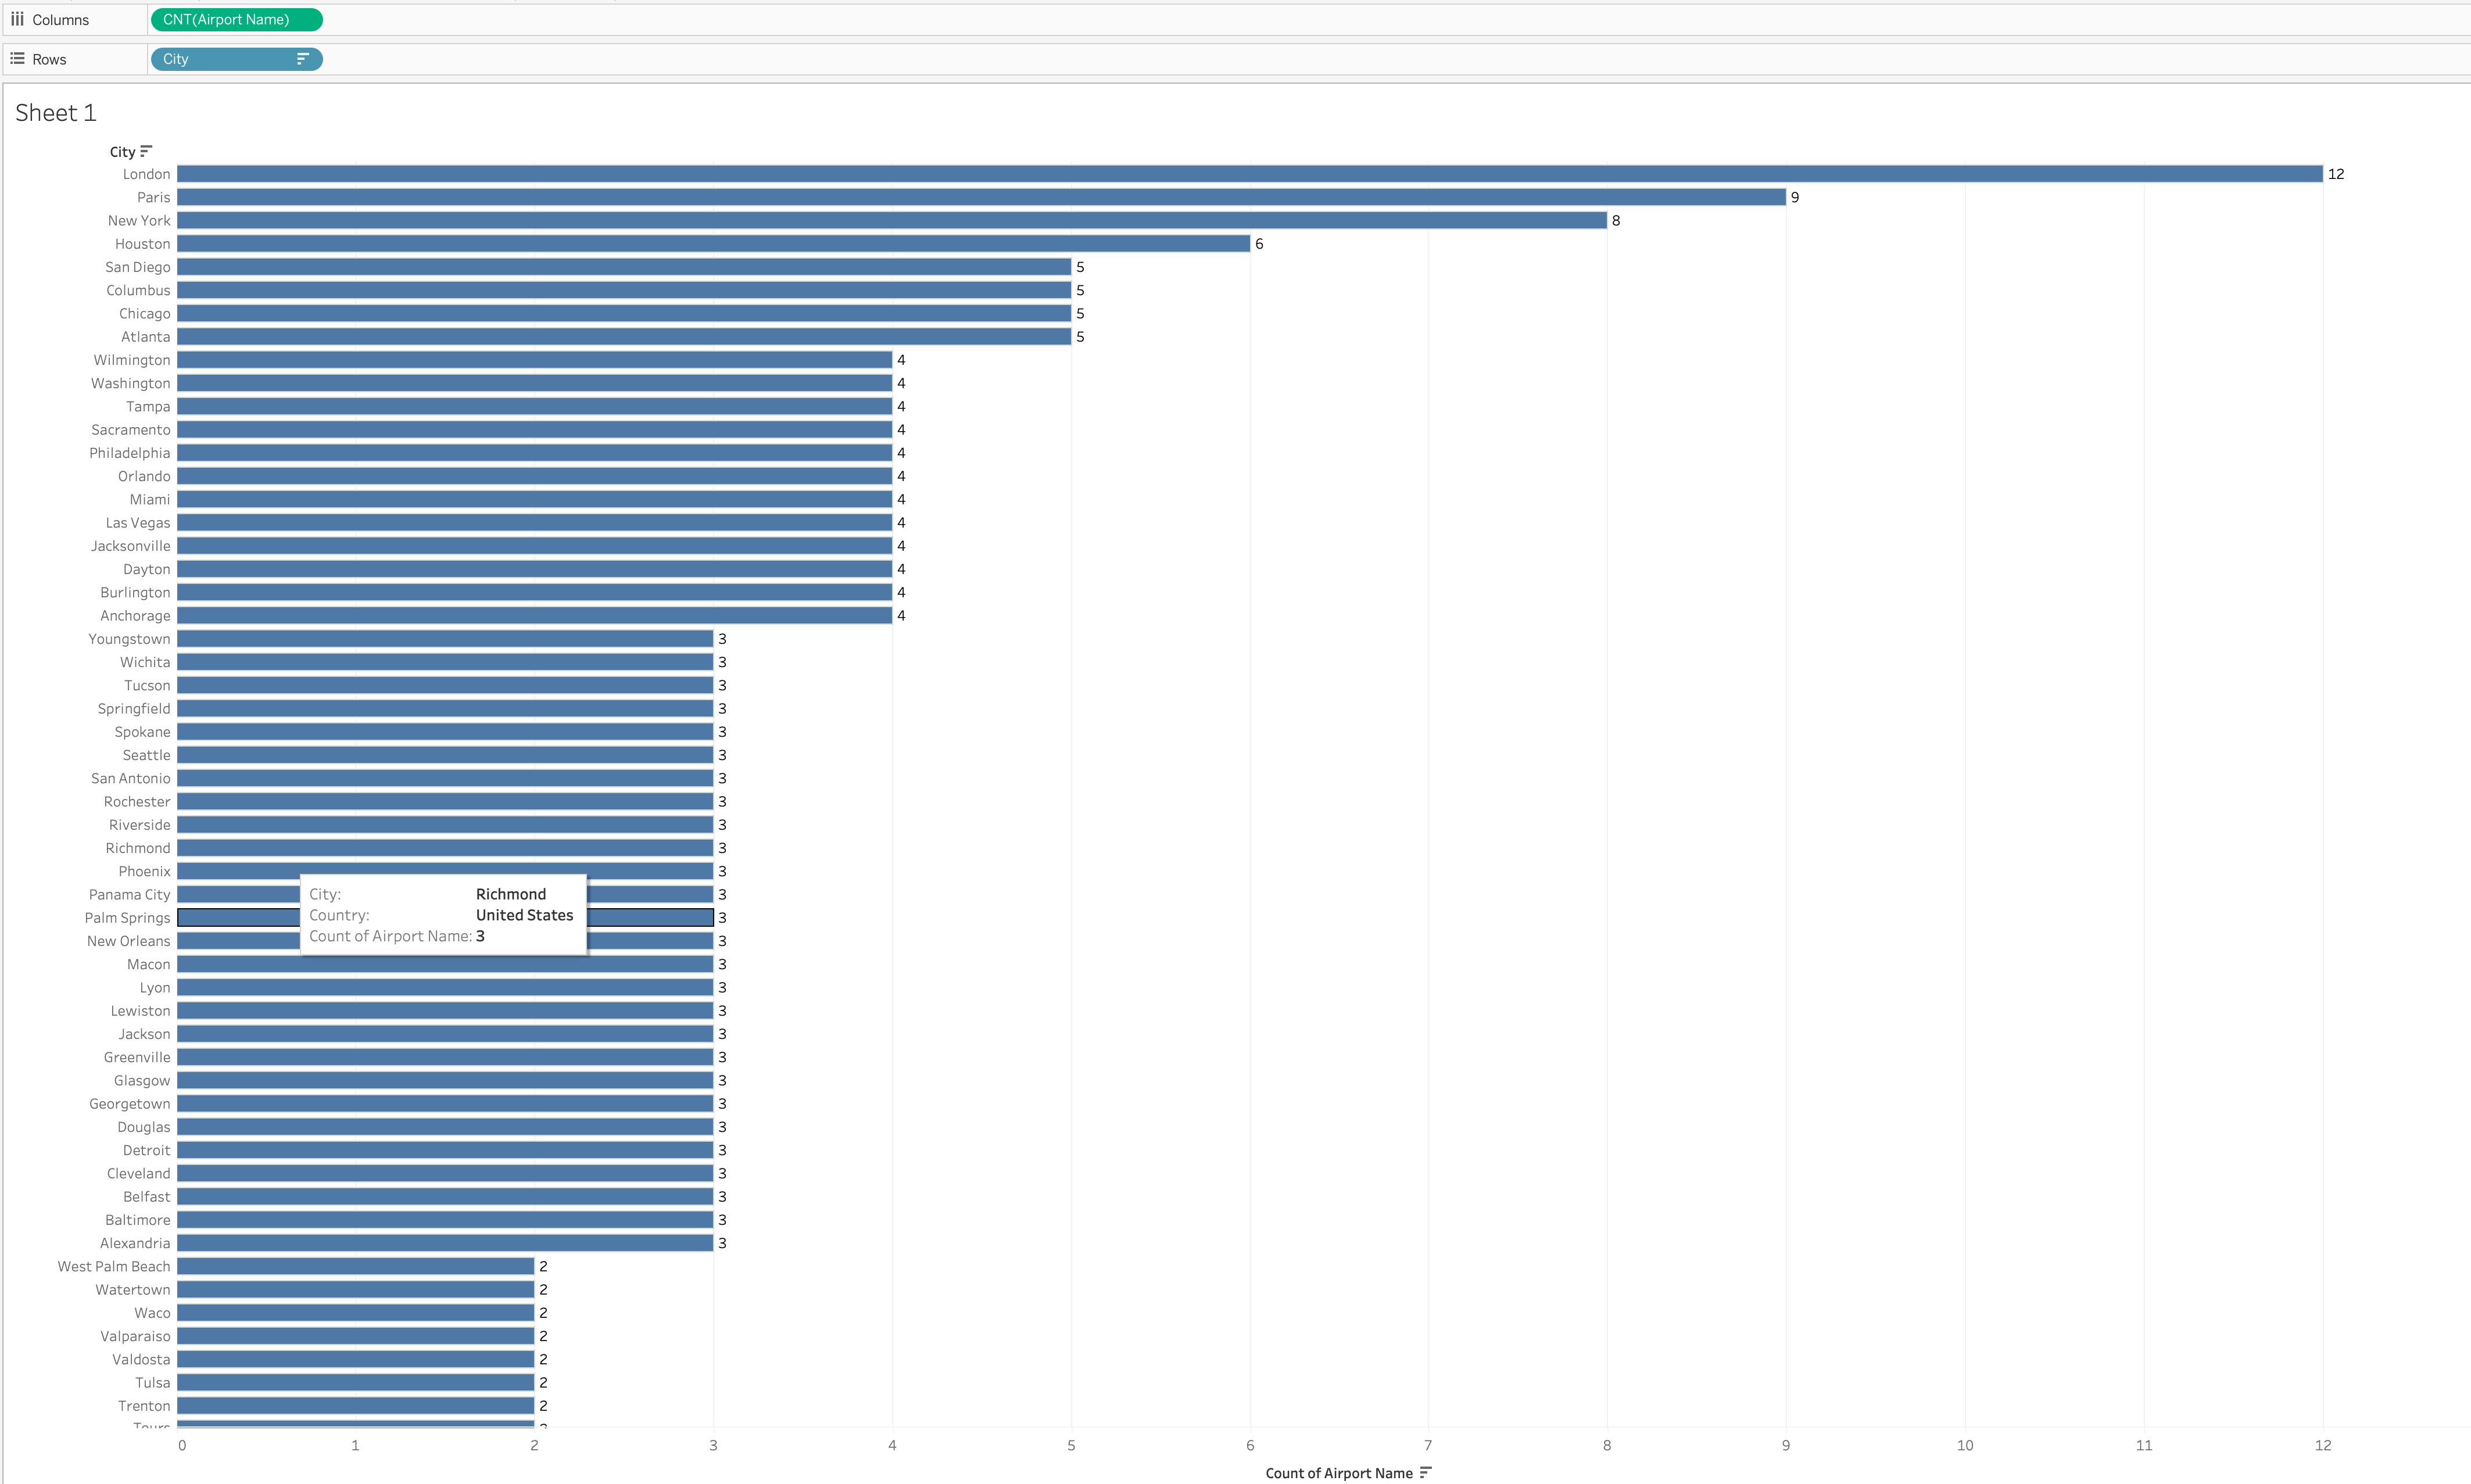
This will create a simple bar graph that shows the number of airports for each city.
You can also filter your results by using the Filters section. Drag and drop the Country field into the Filters section and select the country to filter by.
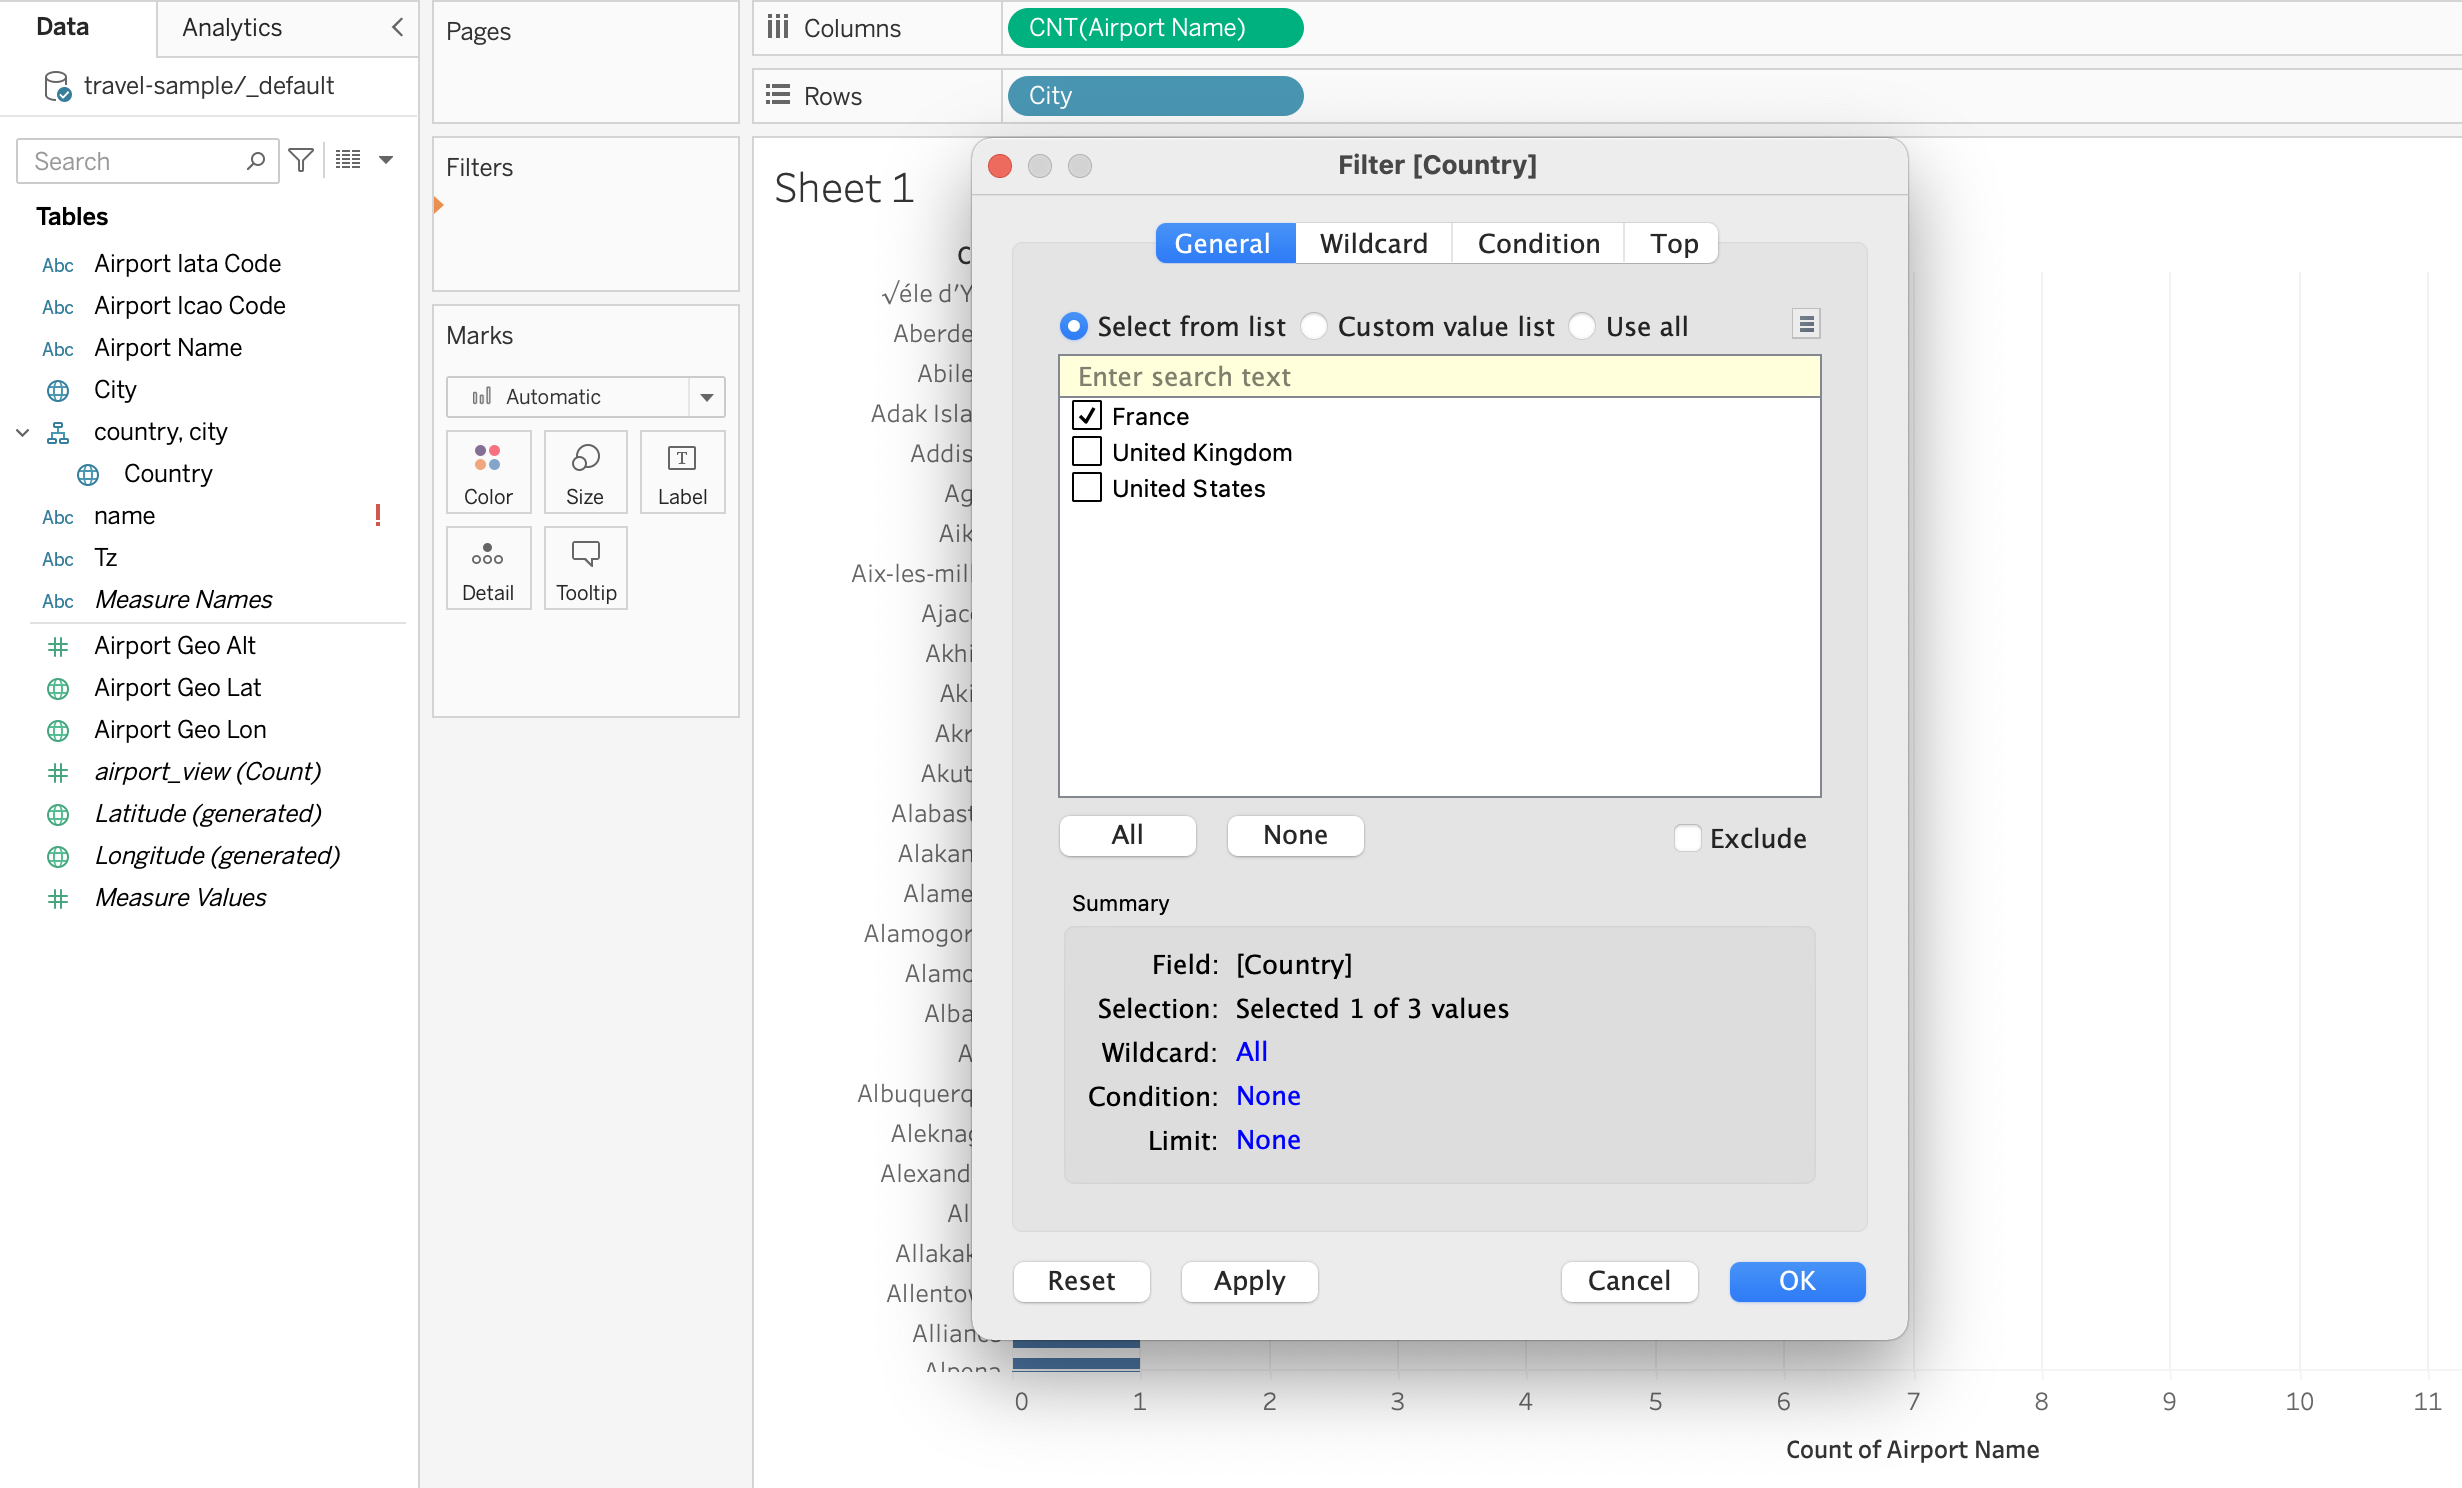
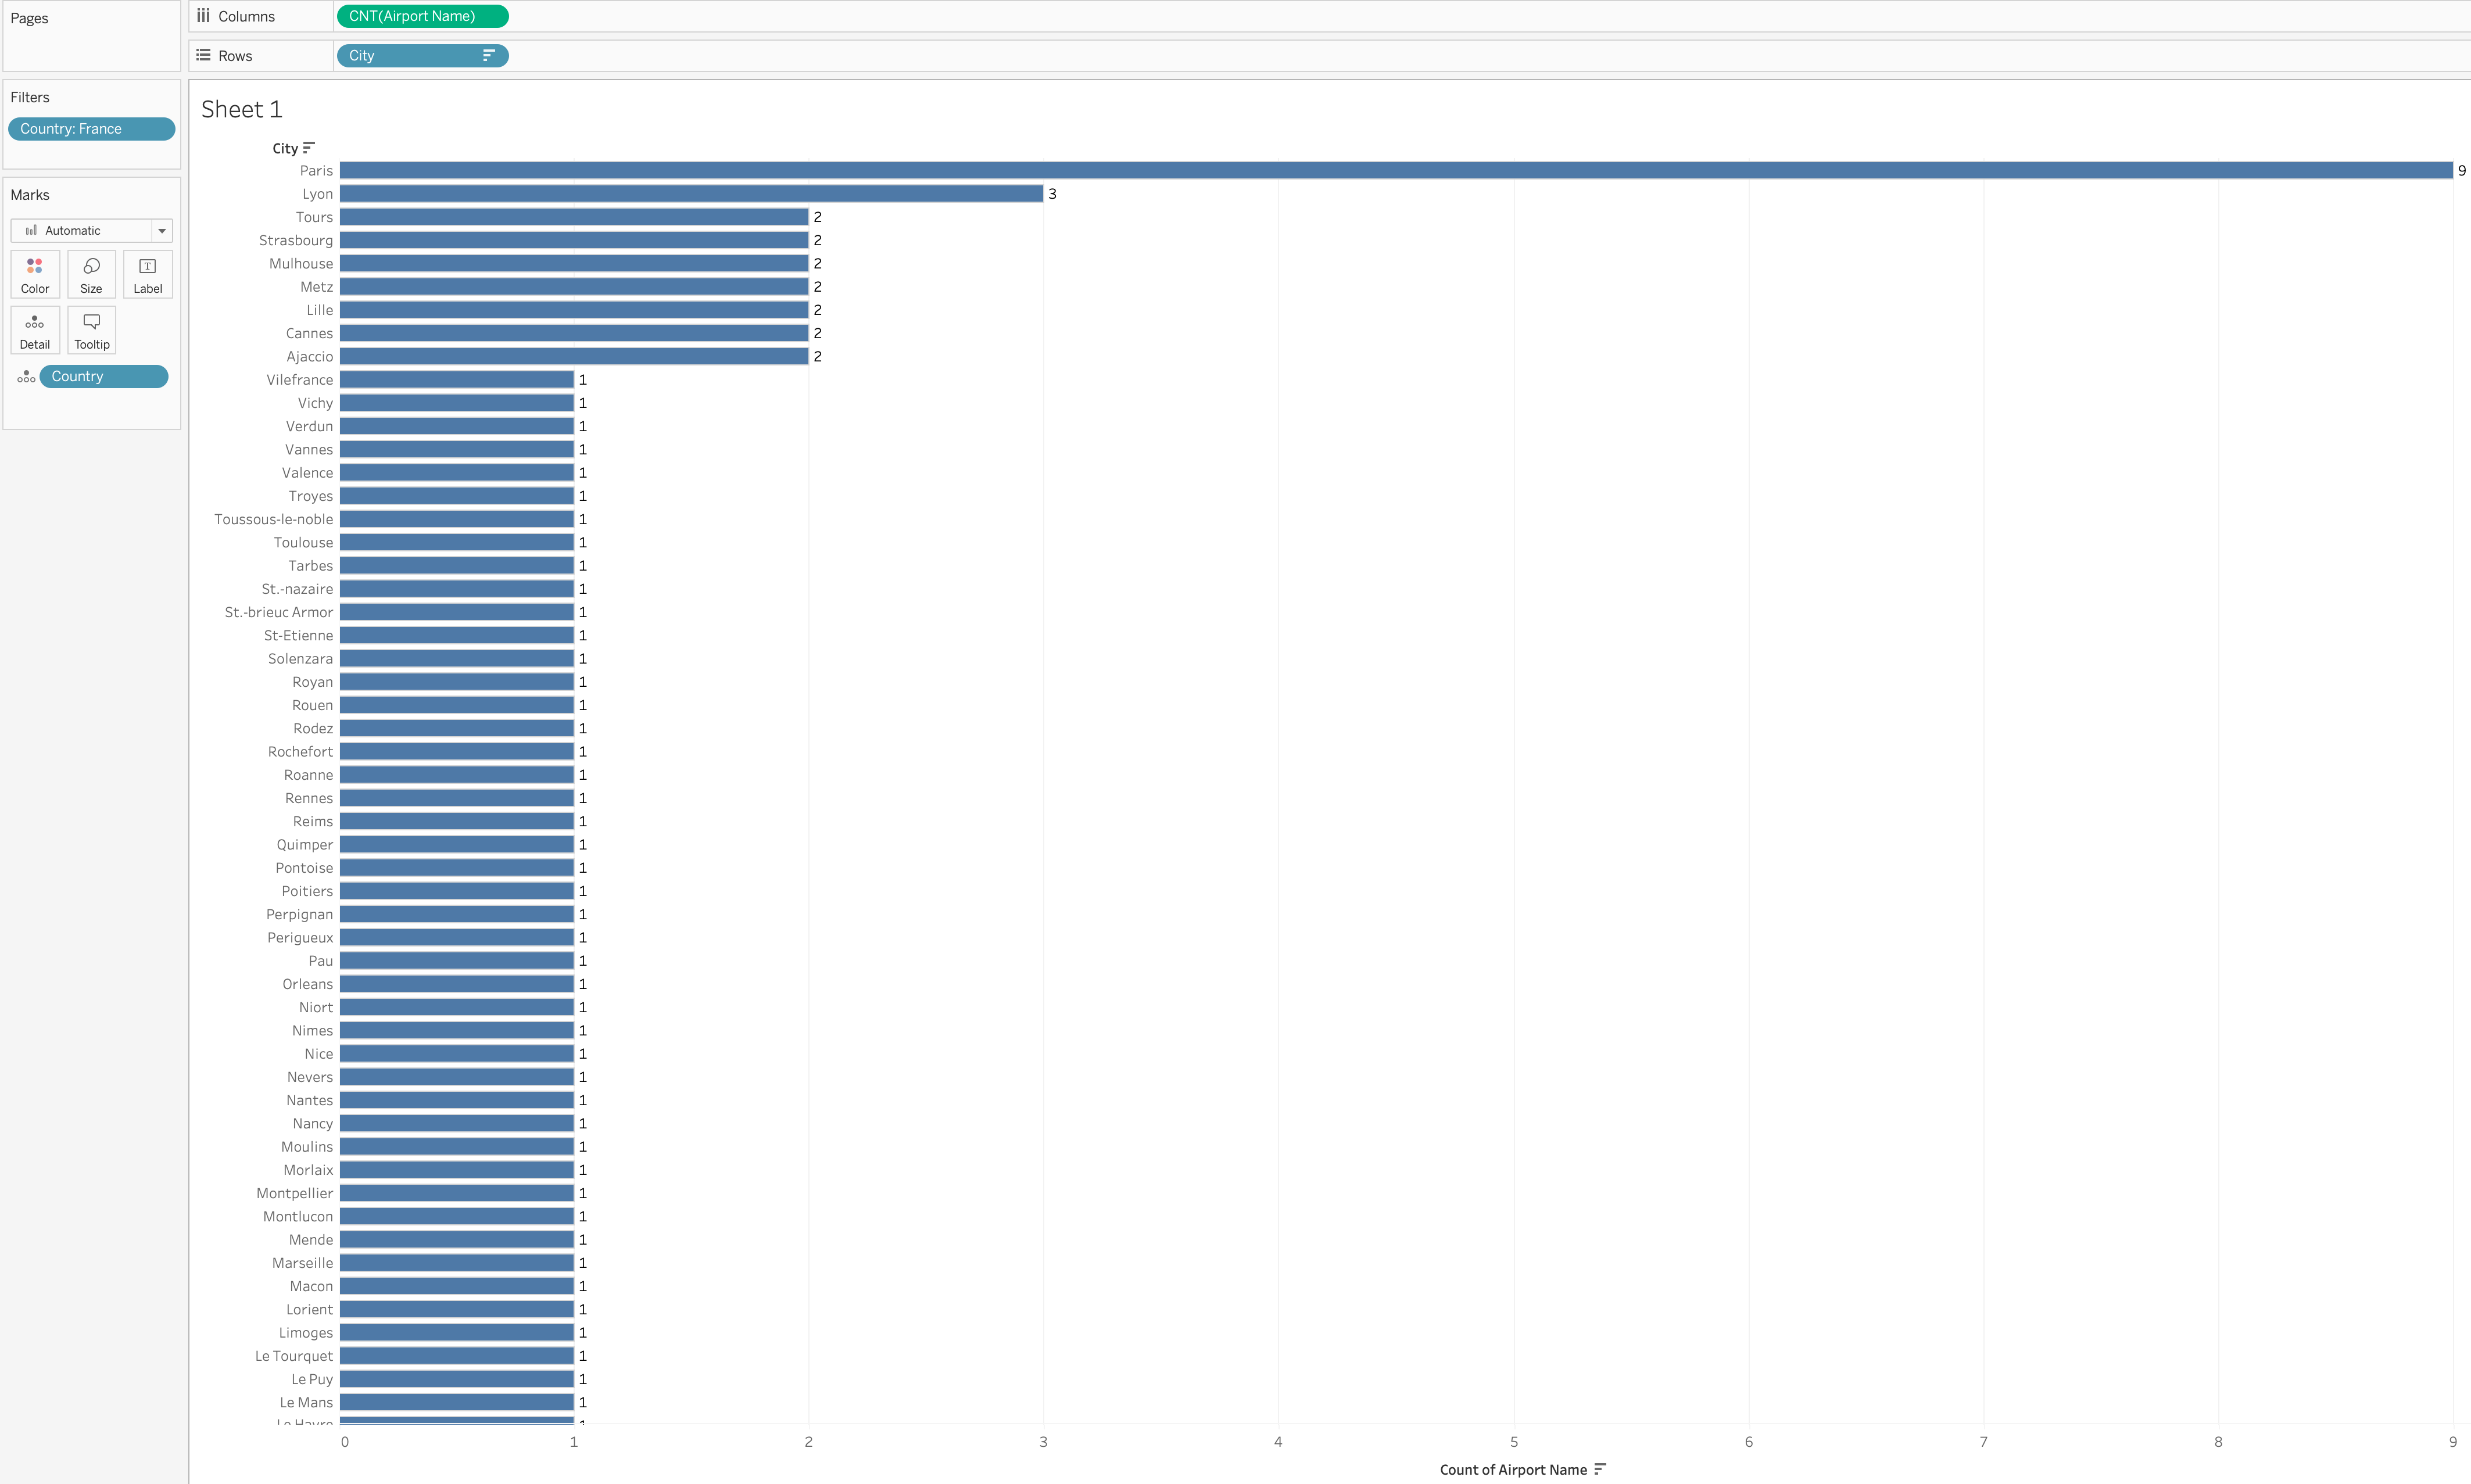
Selecting France then filters out cities from the other countries.
Depending on the view you are using and the type of report you want to build, you can also select how the data is plotted by choosing one of the options in the Marks drop-down.
Use Couchbase Analytics Queries to Build Tableau Worksheets
Apart from the predefined views or any other custom views you create, the Couchbase Tableau connector also supports the use of Analytics queries as the data source.
To use Analytics queries, go to the Data Source tab and select New Custom SQL. Here you can submit queries through the Tableau Connector/JDBC driver that run in a special SQL-compatible mode where certain language constructs operate differently from the regular SQL++ execution.
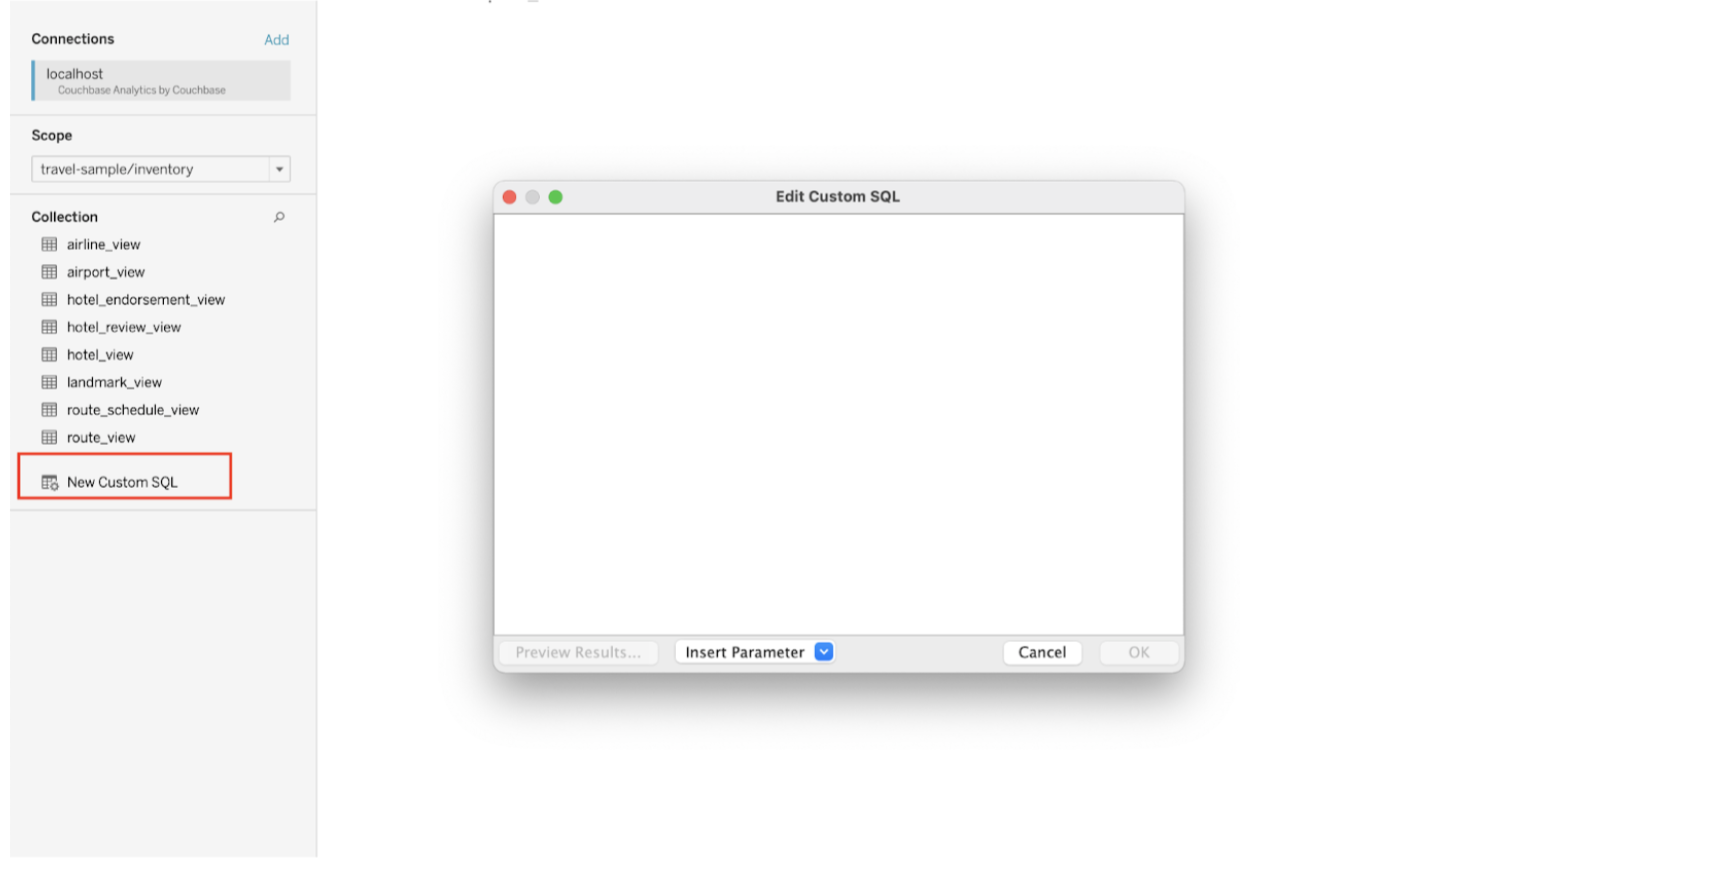
The default scope is set based on the scope if specified in the connection dialog. If no scope is explicitly mentioned, it is set to Default, however users can provide any other scope when setting up the connection. To run Analytics queries, you may specify the Analytics scope along with the collection in your queries. If no scope is specified in a query, the scope set in the connection dialog will be used. For example, to use the airline Analytics collection, use `travel-sample`.inventory.airline.
|
Run Analytics Queries on Tableau
A simple Analytics query you can execute is to get the counts of the hotels per city. In the Edit Custom SQL window, add the following query and select Preview Results.
select
 country,
 city,
 count(id) as count
from `travel-sample`.inventory.hotel
group by country, city
order by count(id) desc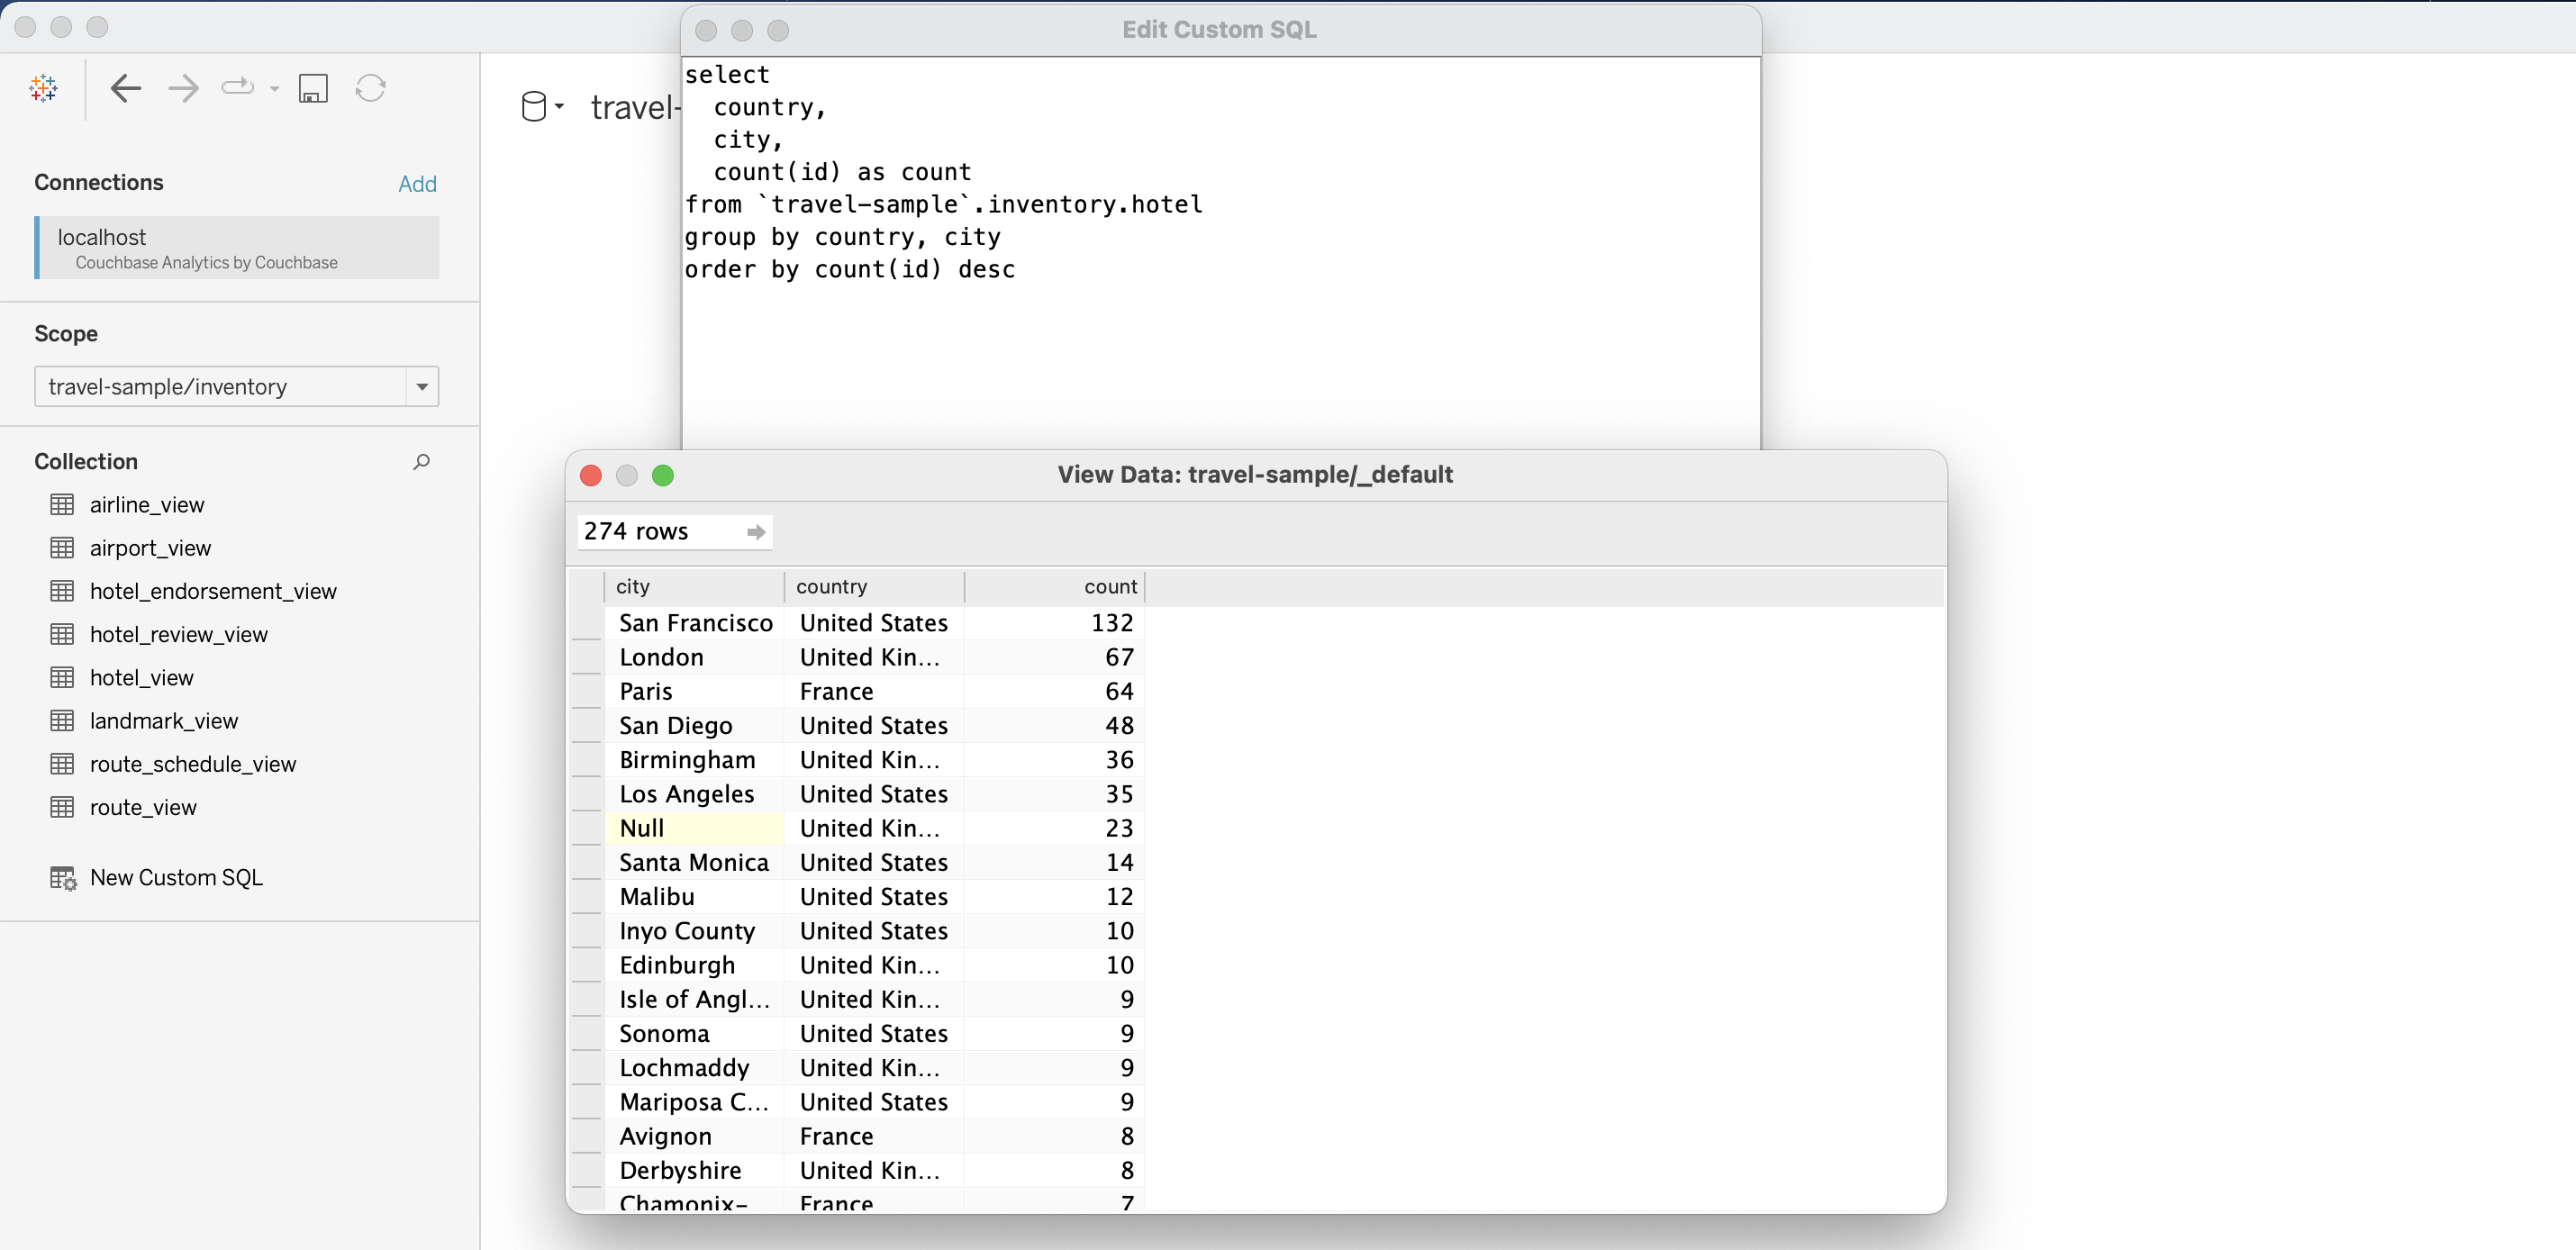
You can also use queries that join multiple Analytics collections. For example, to get the airlines with the most routes you can run the following query.
select a.id,
 a.callsign,
 a.name,
 a.country,
 count(r.id) as route_count
from `travel-sample`.inventory.airline a
join `travel-sample`.inventory.route r on META(a).id = r.airlineid
group by a.id, a.callsign, a.name, a.country
order by route_count desc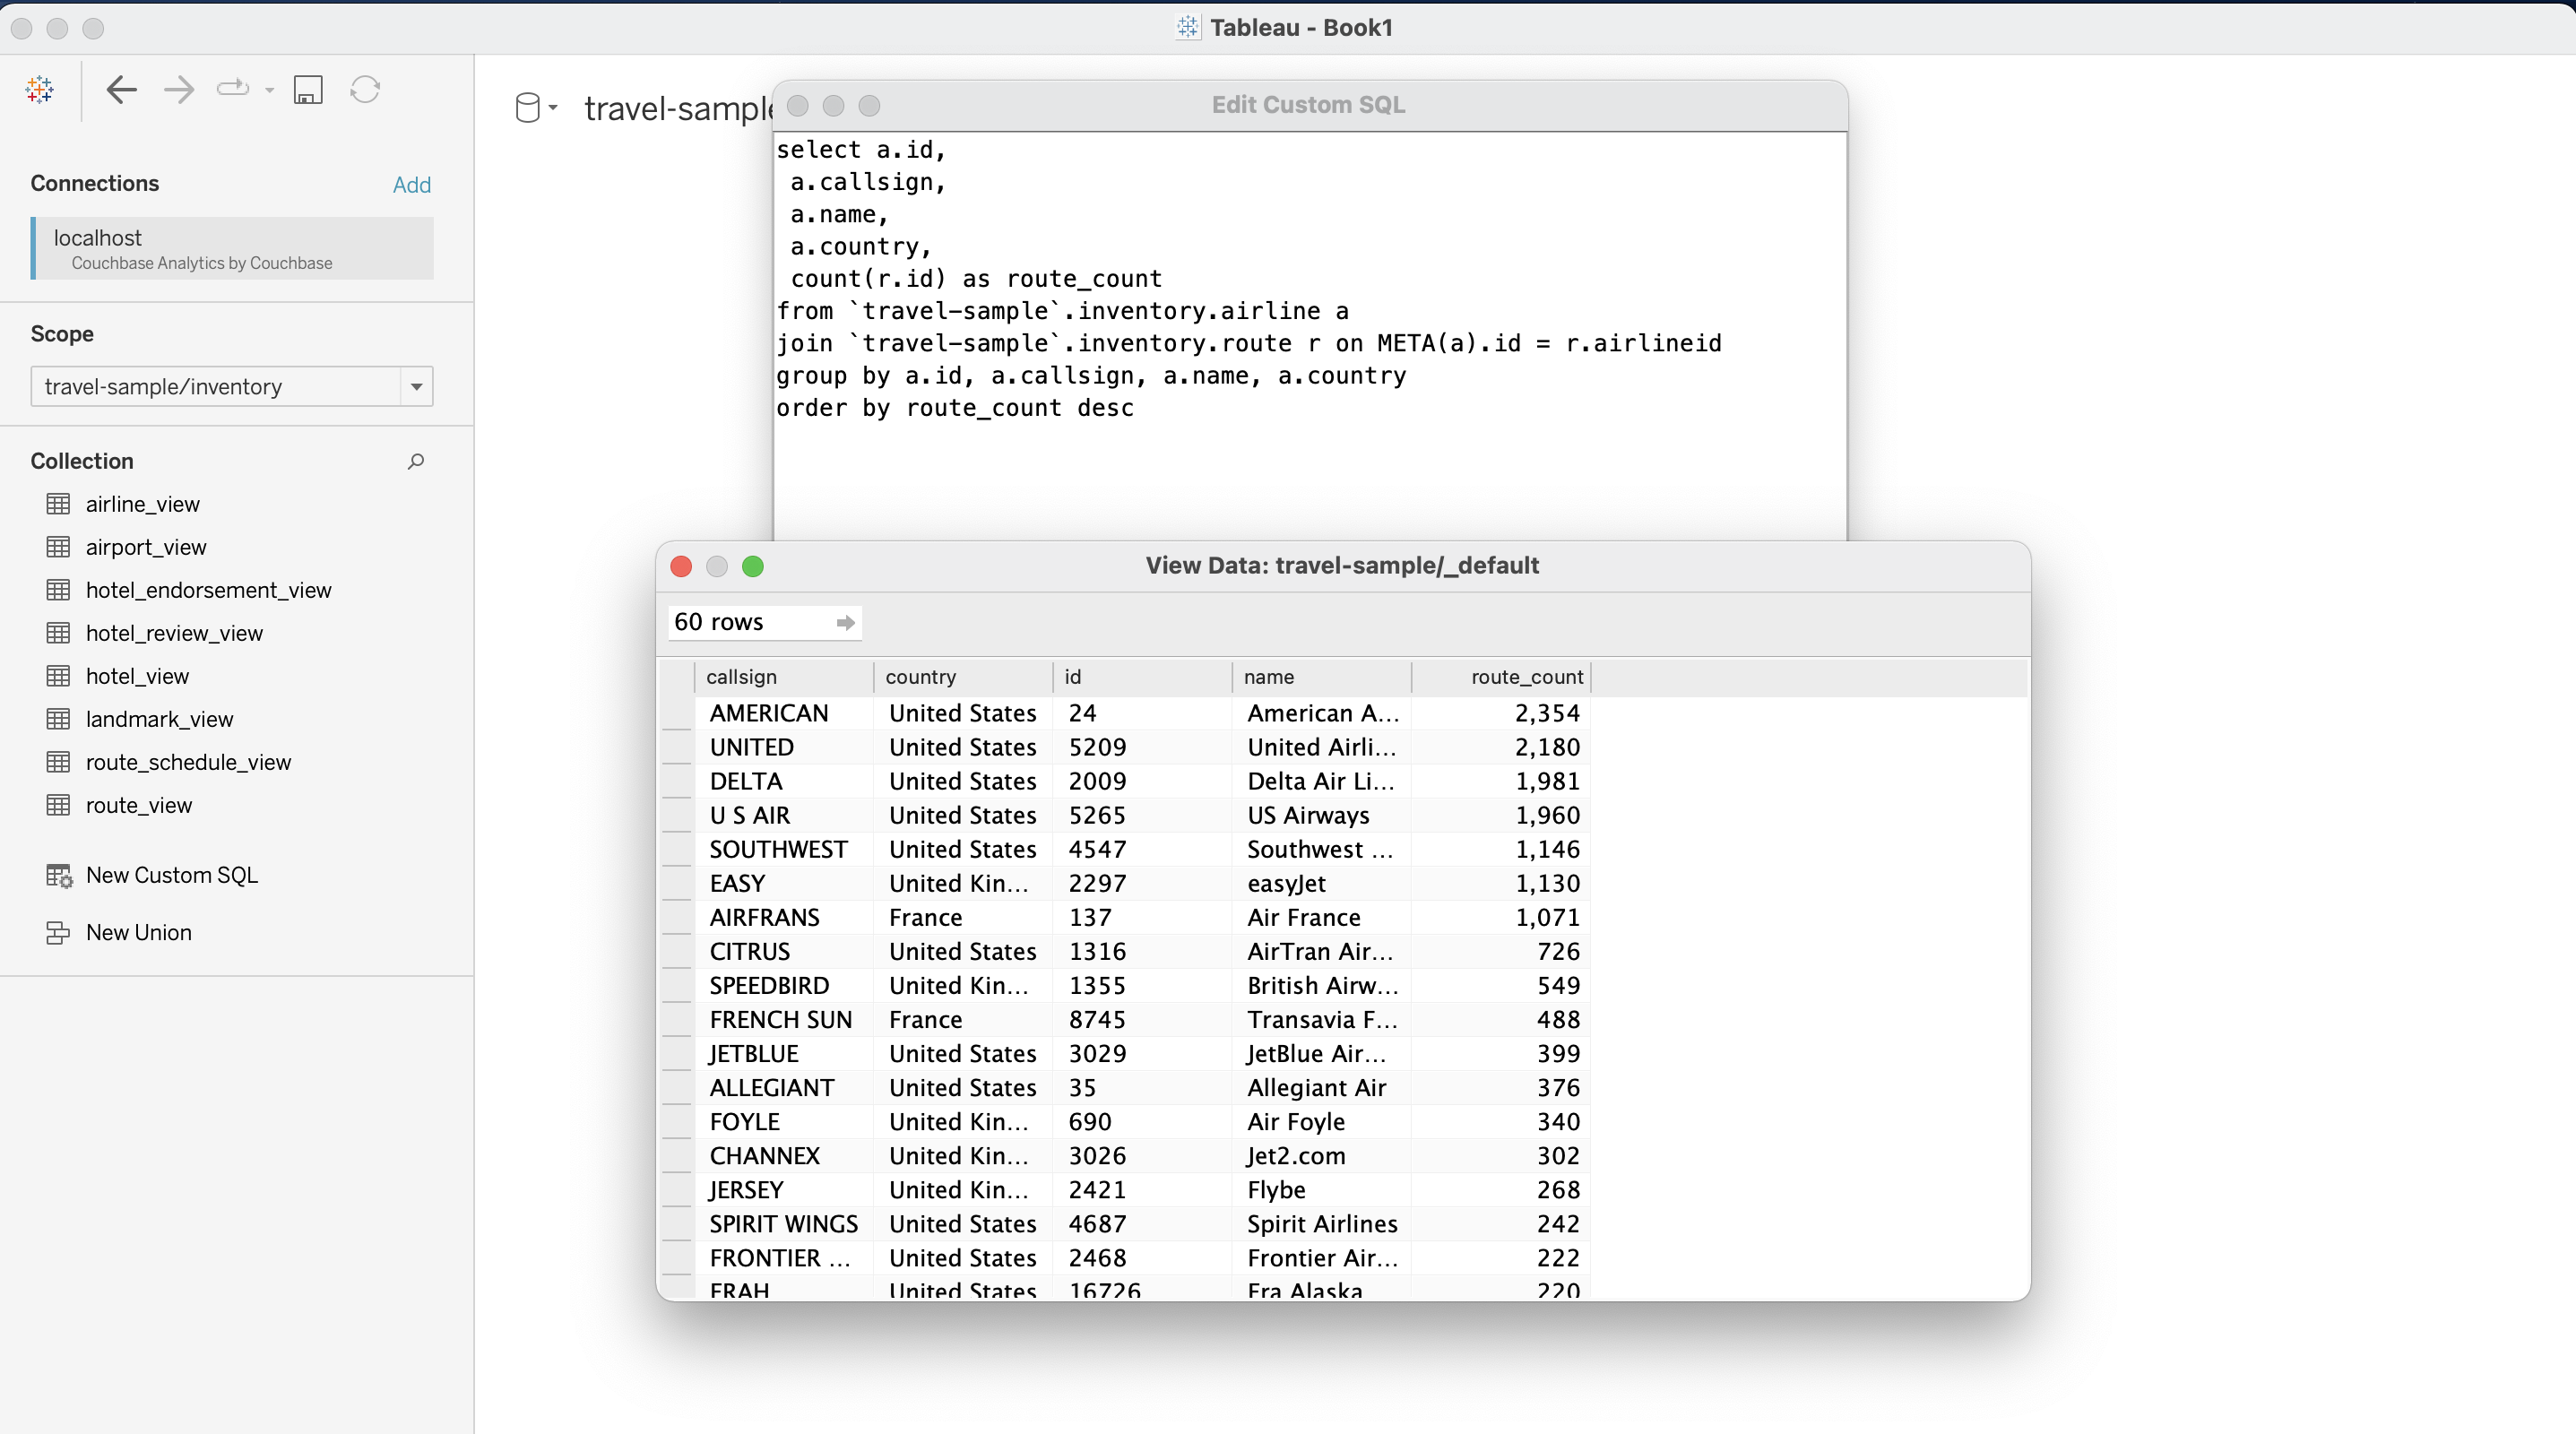
The previous query can be expanded upon further by getting the percentile rank of airlines with the most routes with the following query.
select
 a.id,
 a.callsign,
 a.name,
 a.country,
 count(r.id) as route_count,
 PERCENT_RANK() OVER (
  ORDER BY count(r.id)
  ) AS `rank`
from `travel-sample`.inventory.airline a
join `travel-sample`.inventory.route r on META(a).id = r.airlineid
group by a.id, a.callsign, a.name, a.country
order by route_count desc
limit 100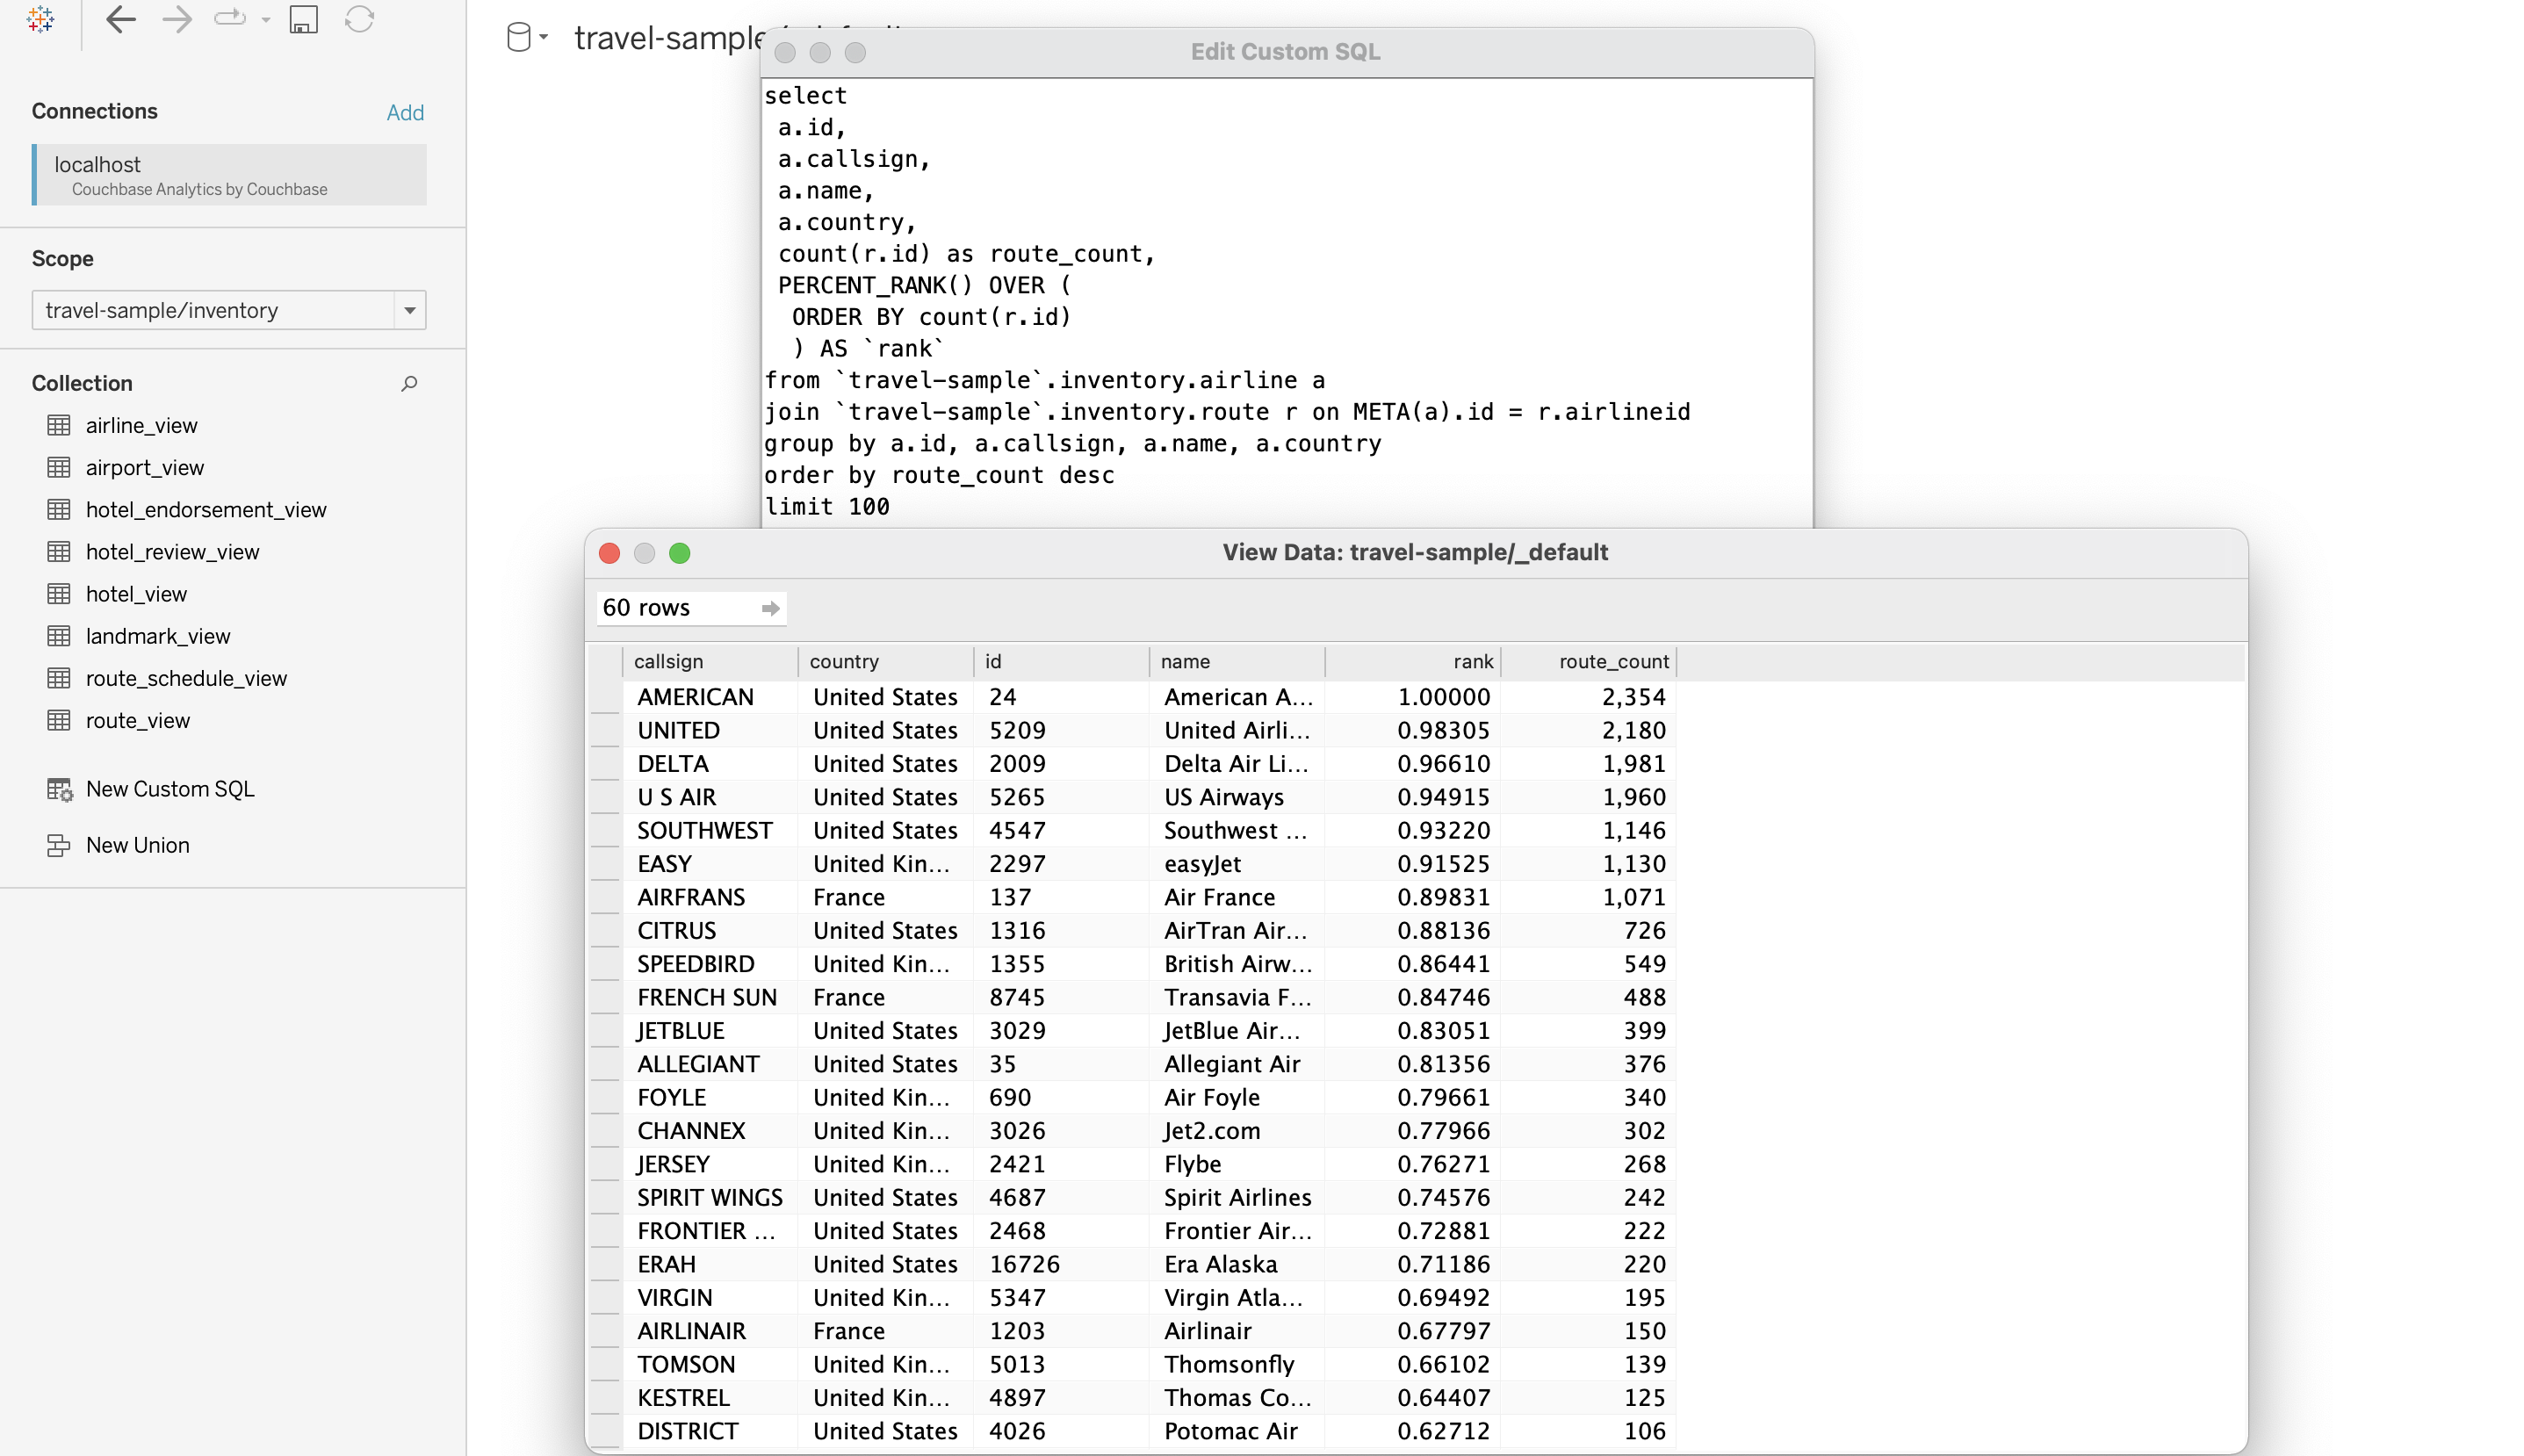
Use Analytics Queries as the Data Source to Build Tableau Reports
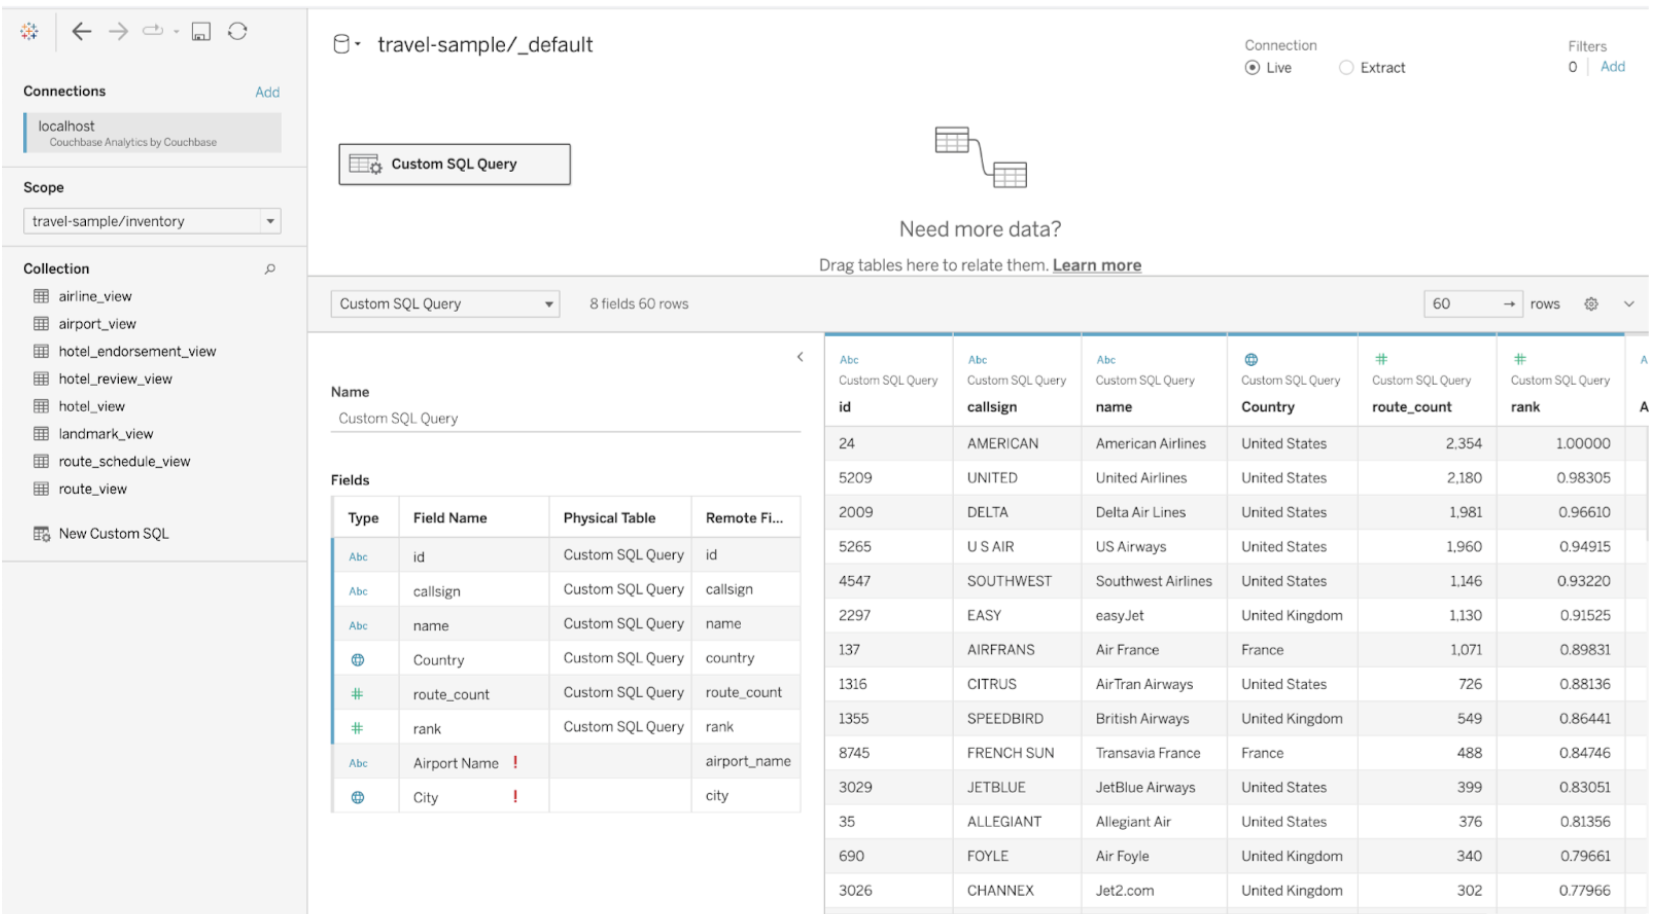
Once you have executed your query, you should be able to see the data from the query in a tabular form.
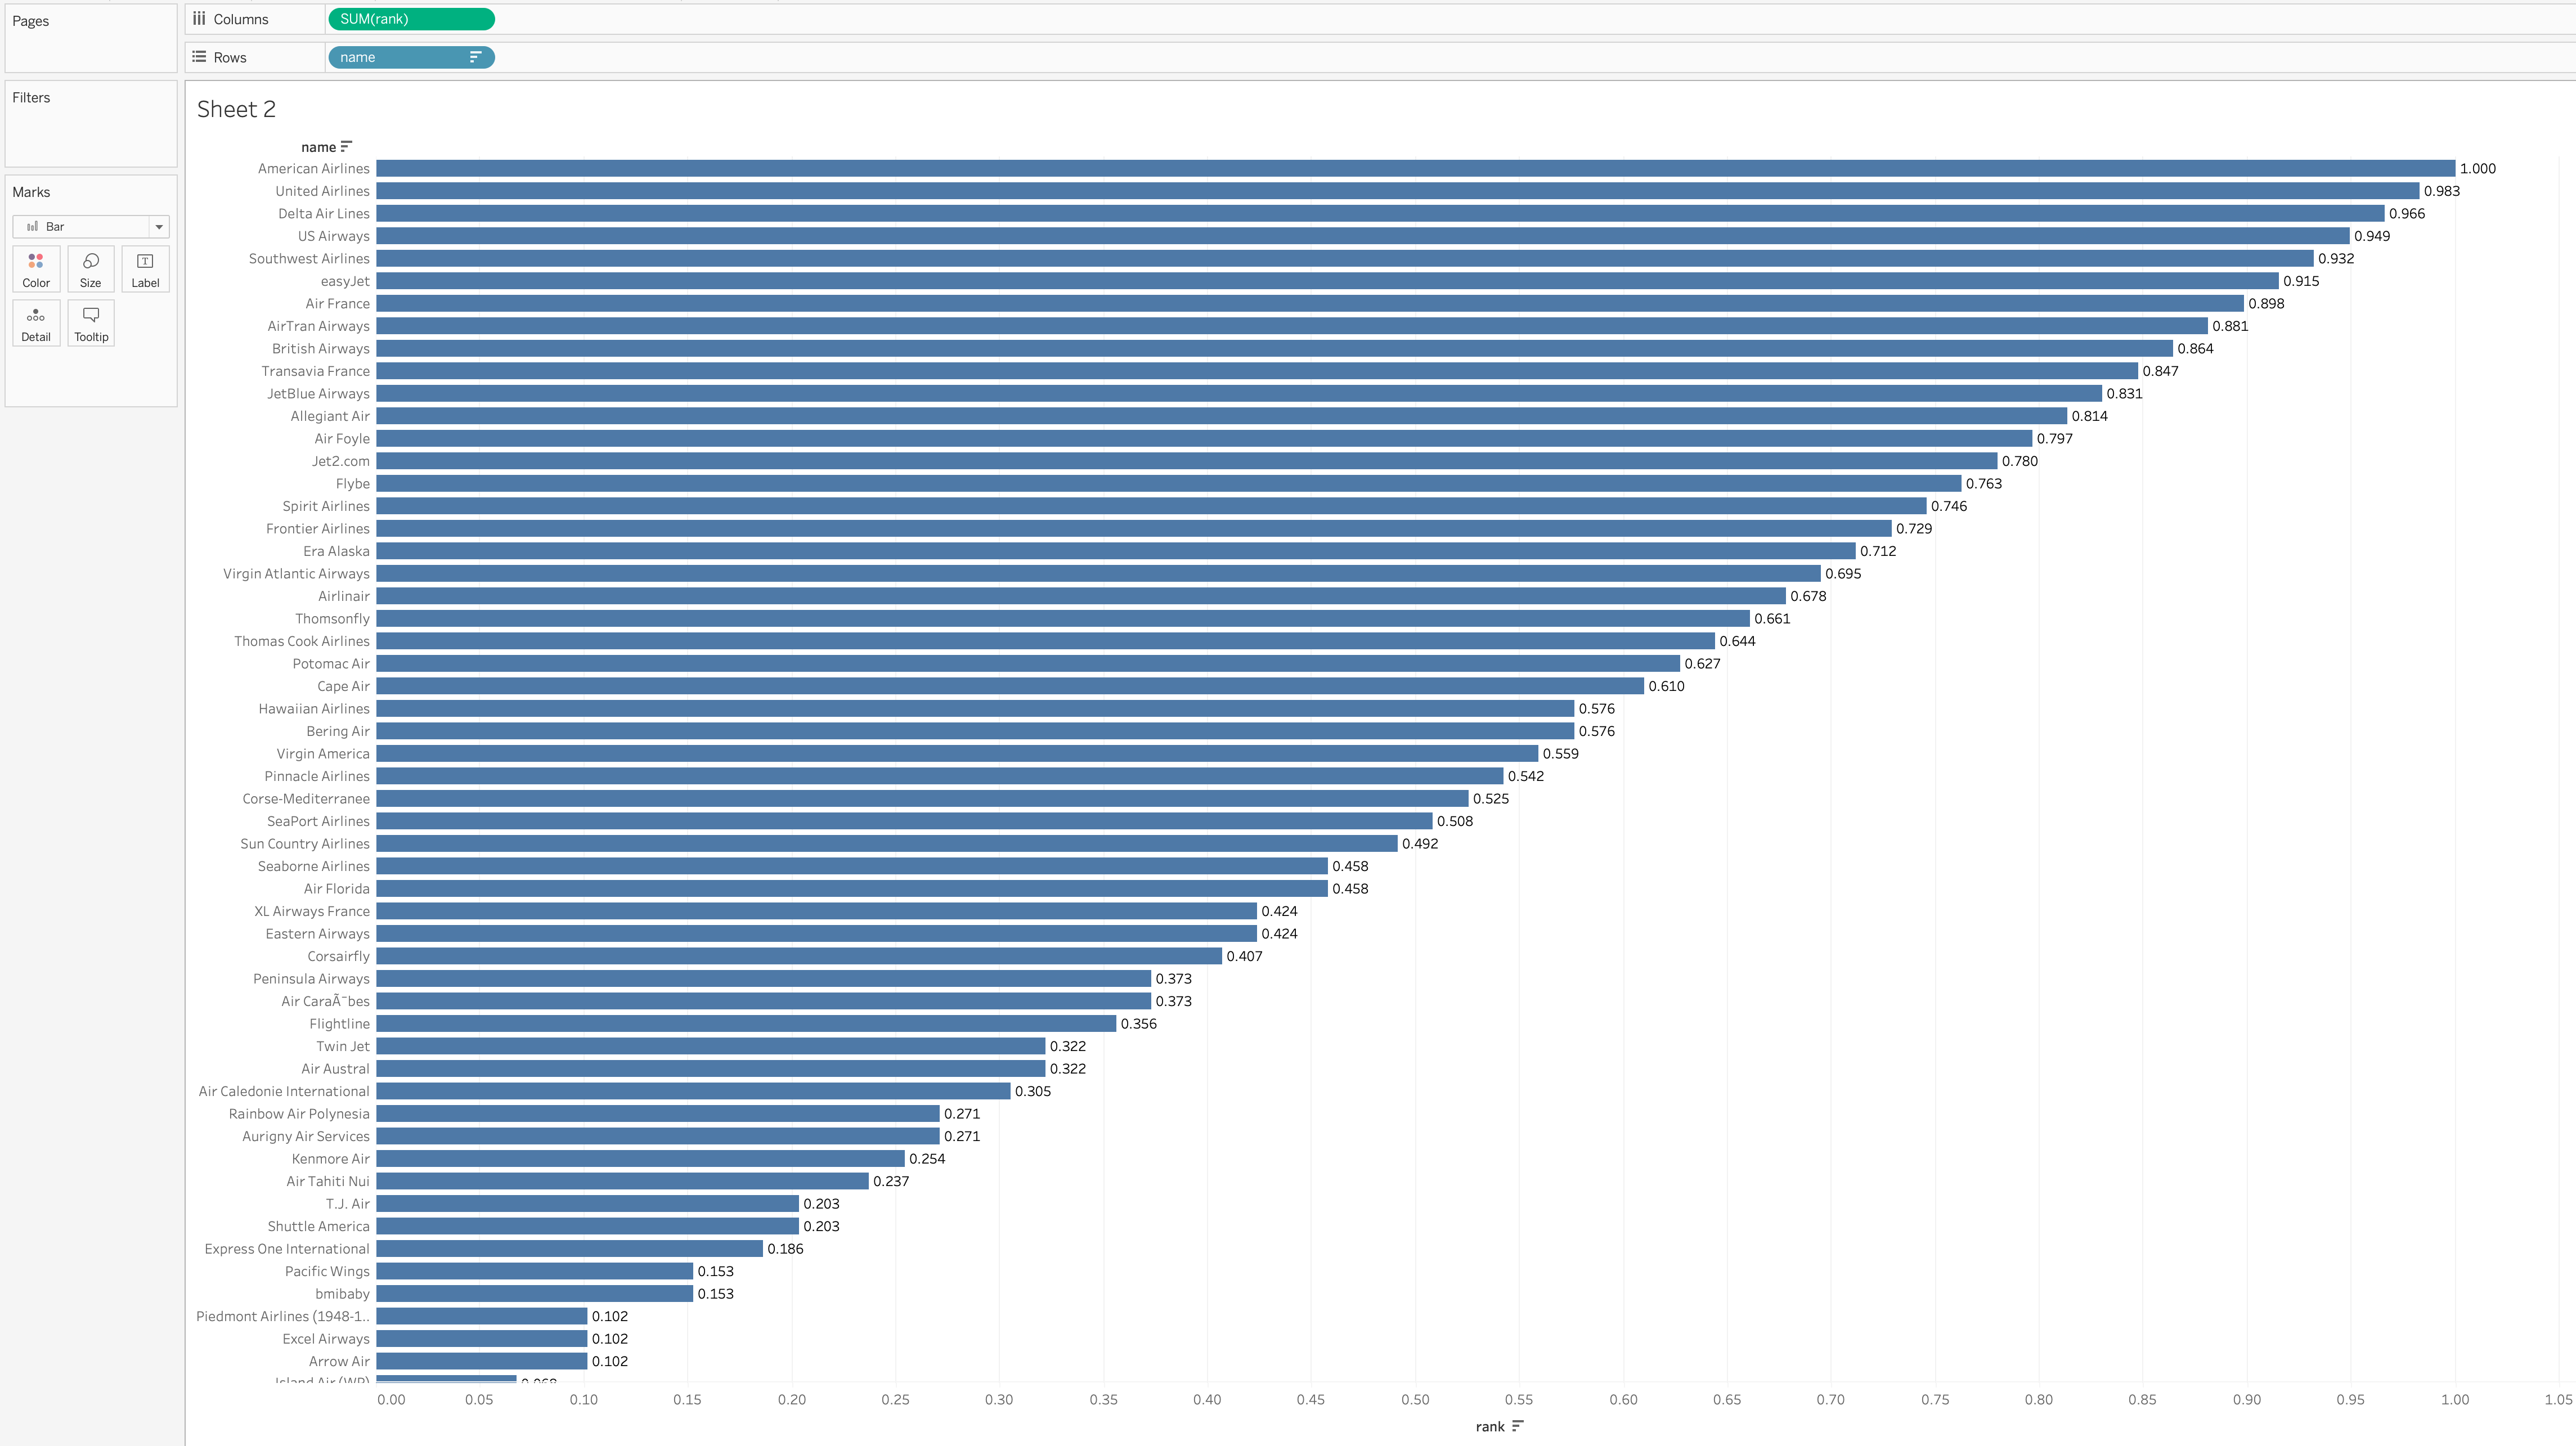
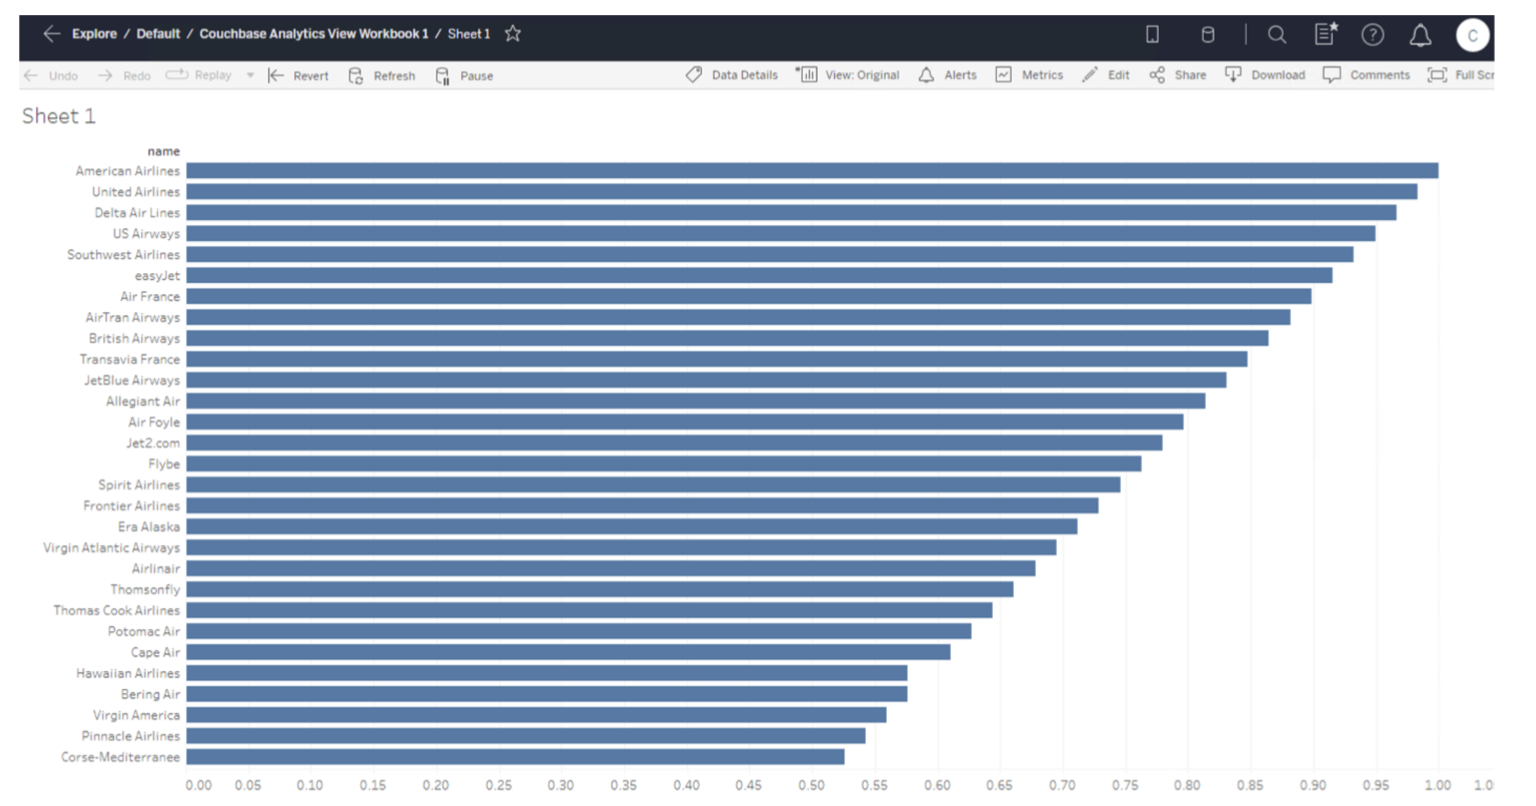
Go to the Sheet tab and add the name field to the Rows section and the rank field generated by the query to the Columns section. You can then click on the rank label on the graph to sort the chart in from highest to lowest rank.
Publish Workbook to Tableau Server
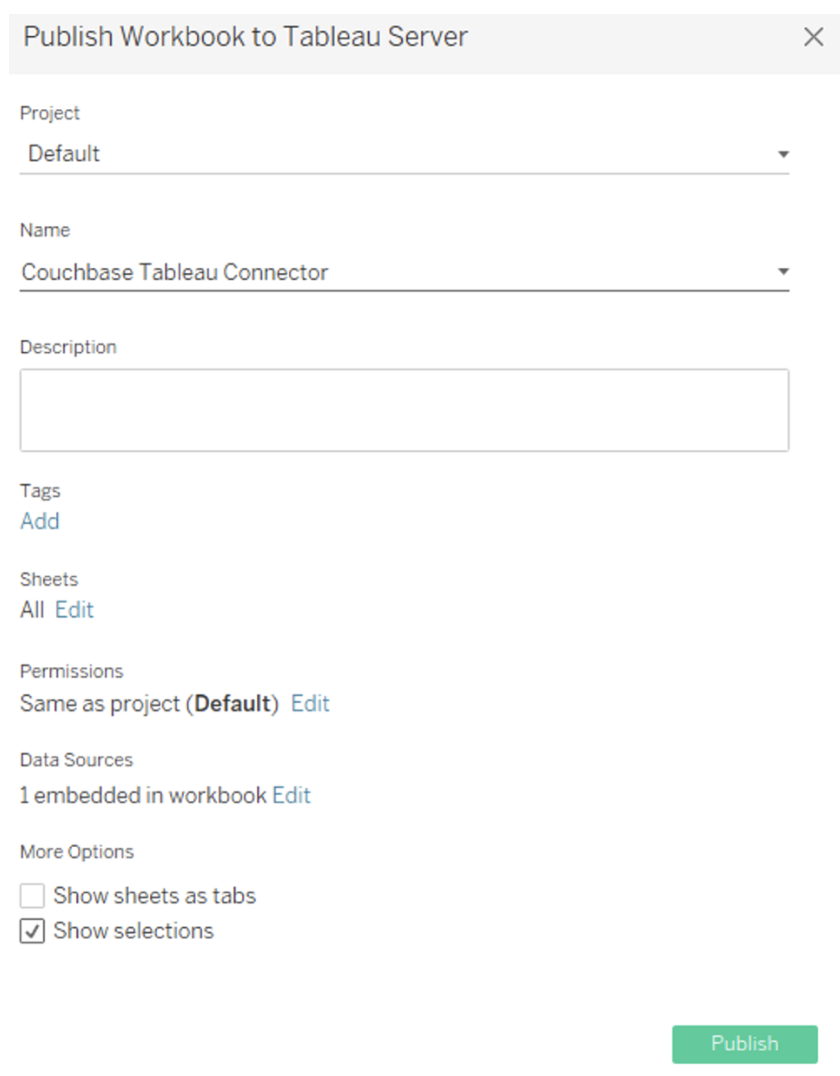
Once you have created your reports, you can then publish them onto Tableau Server. From the menu, select .
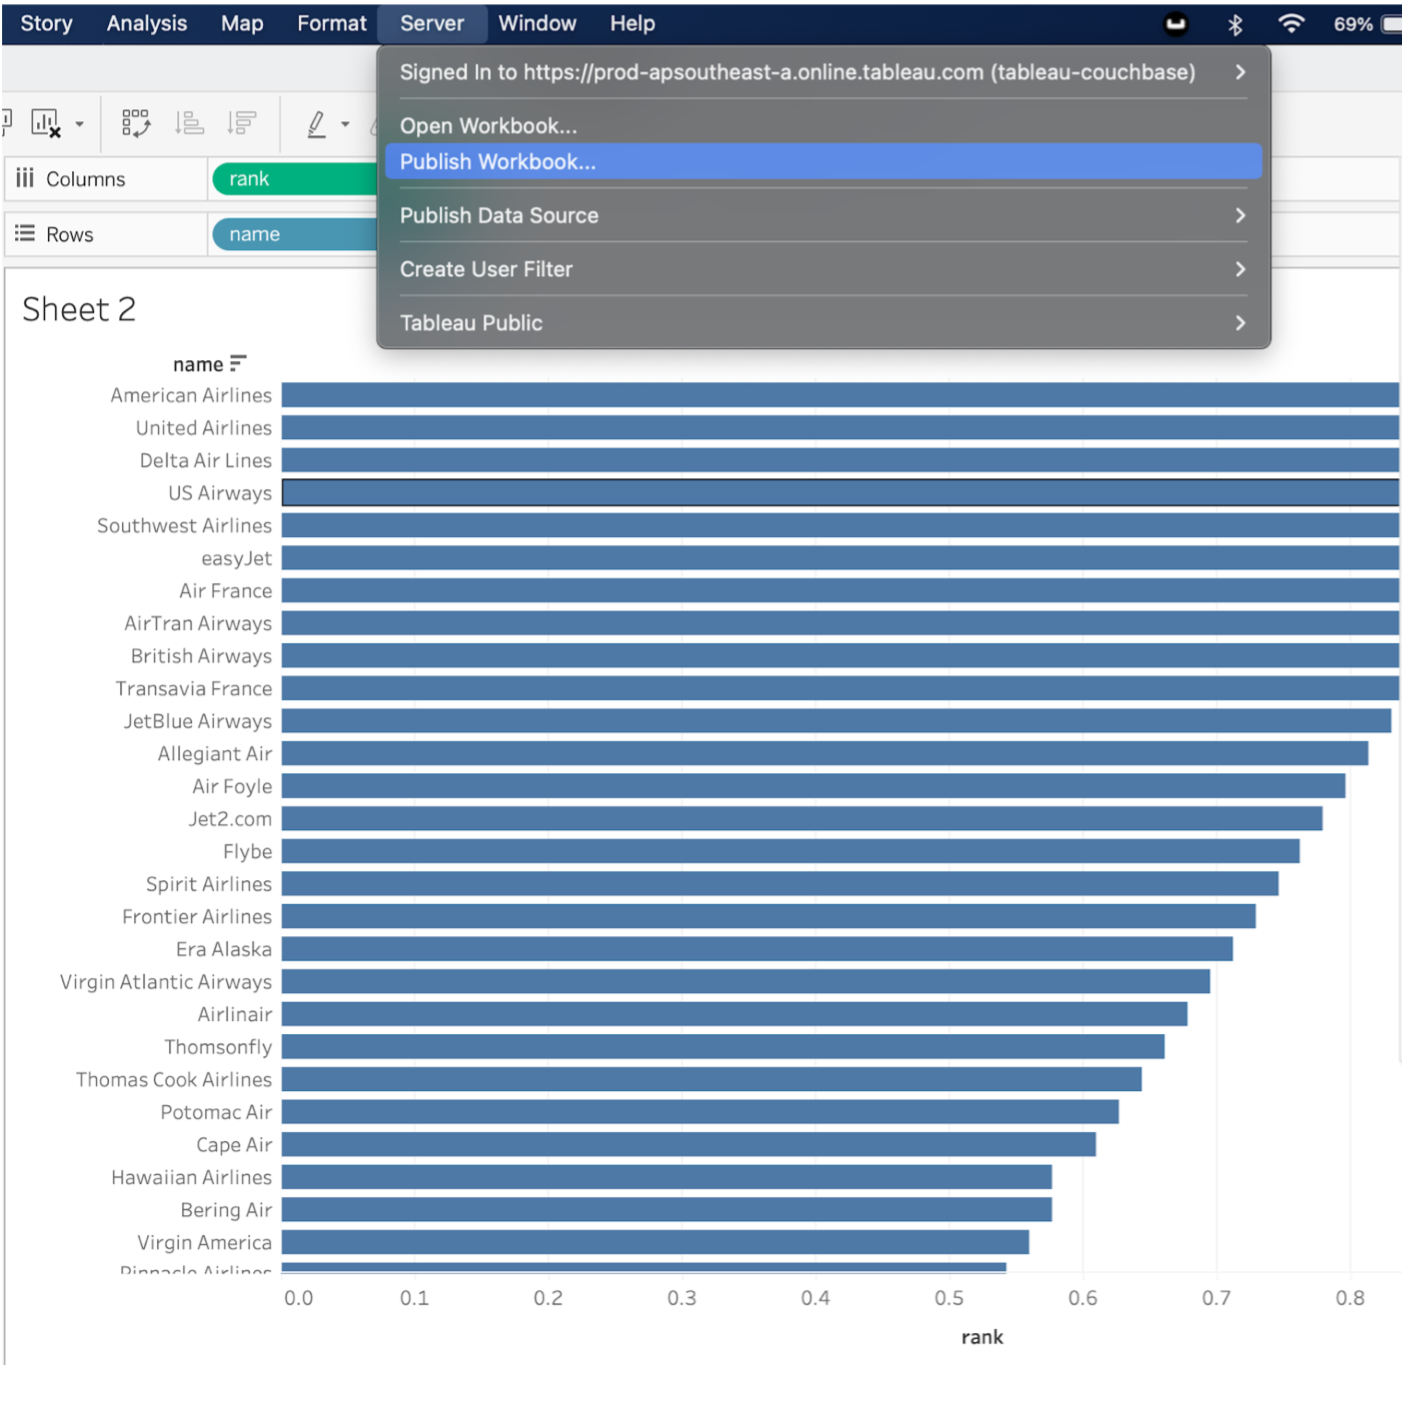
Select the project to publish the workbook to and give it a name. Once you have selected the options you need, click on the Publish button.
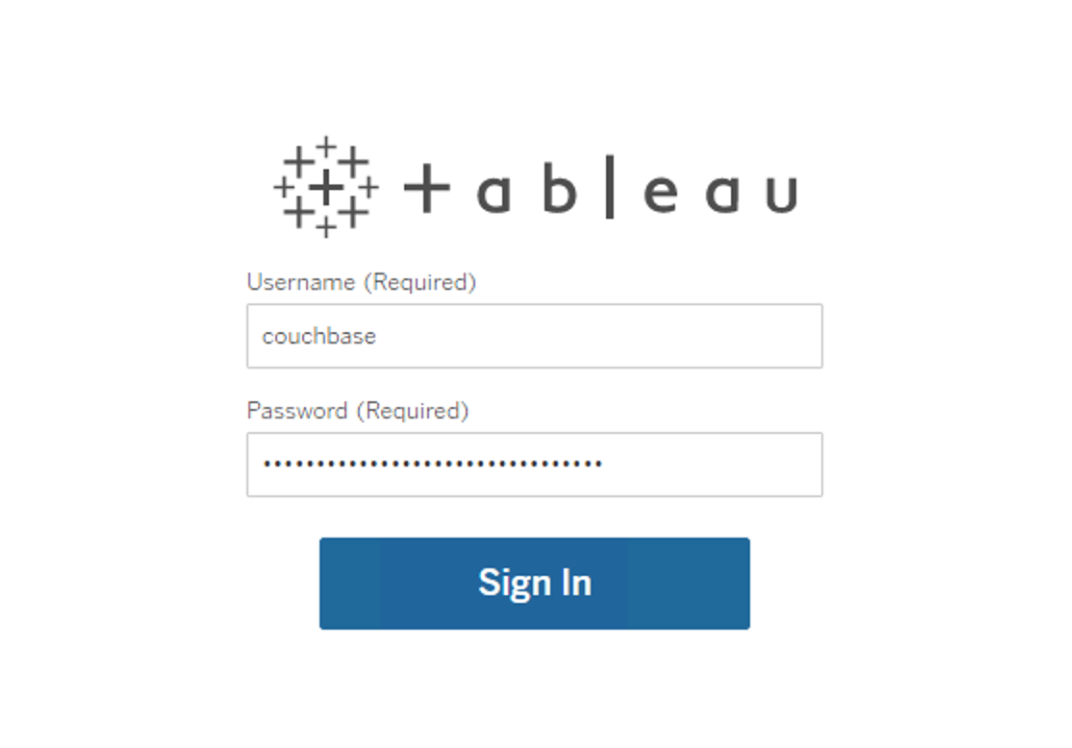
Once published your browser will launch, and you will be prompted to log in to Tableau Server. Log in using you Tableau Server user account credentials.
Once you are successfully logged in, you should see the workbook you created using Tableau Desktop.
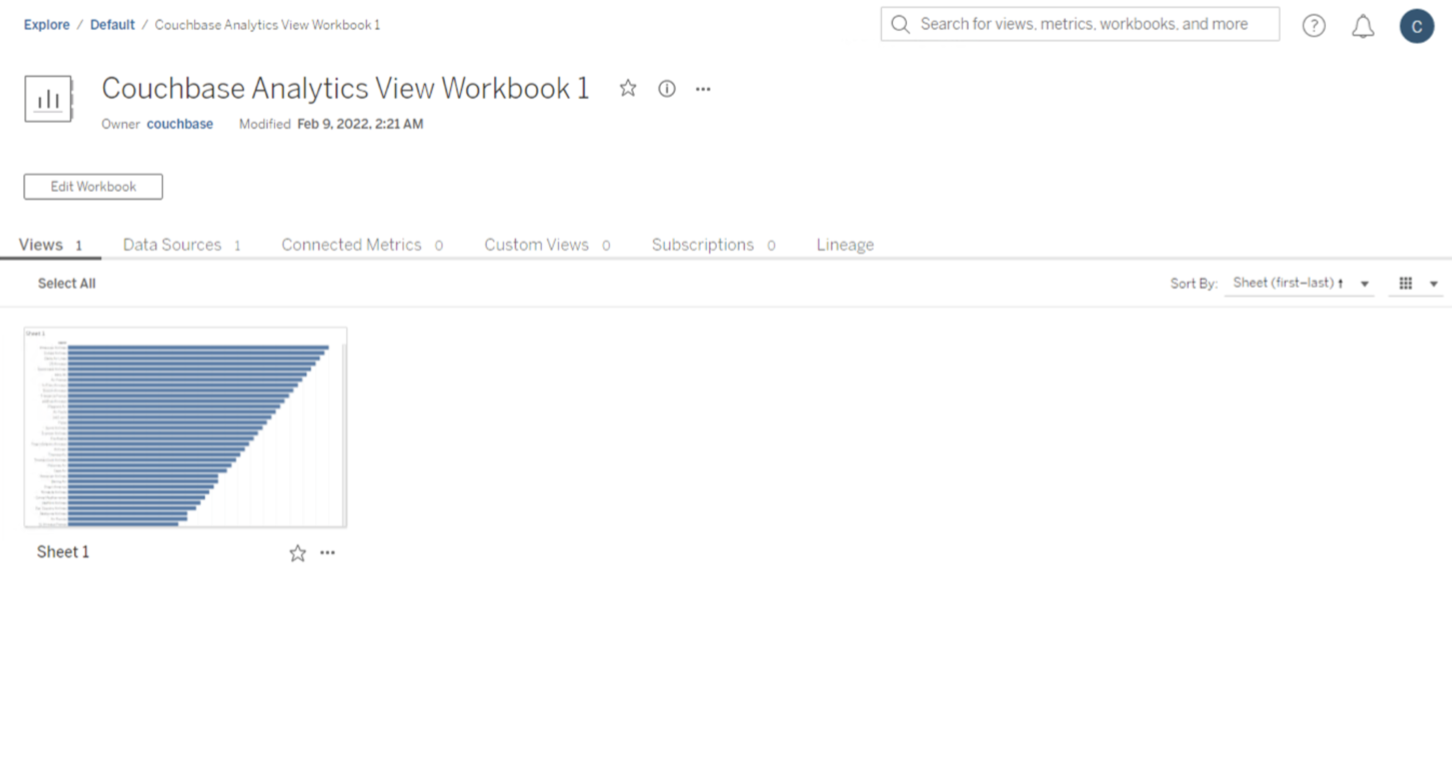
You can click on the workbook to view it in greater detail. From this page you can also refresh the data so that your report reflects any updates made to the source.
Publish Data Sources to Tableau Server
You can also publish you data source directly to Tableau Server from Tableau Desktop. This will allow users with access to your Tableau Server project to view and build their own workbooks and reports using the Couchbase Analytics data source you have set up on Tableau Desktop. From the menu, select .
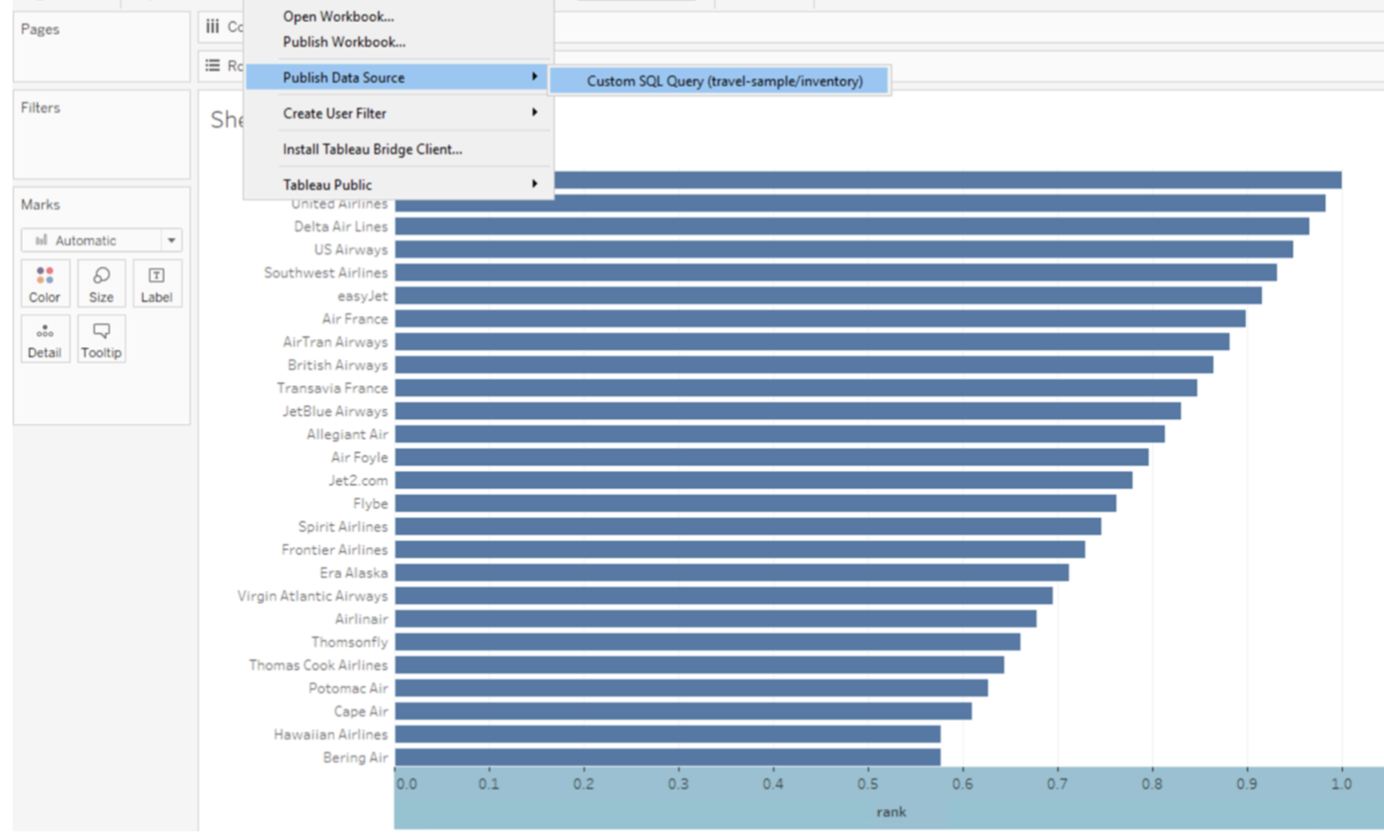
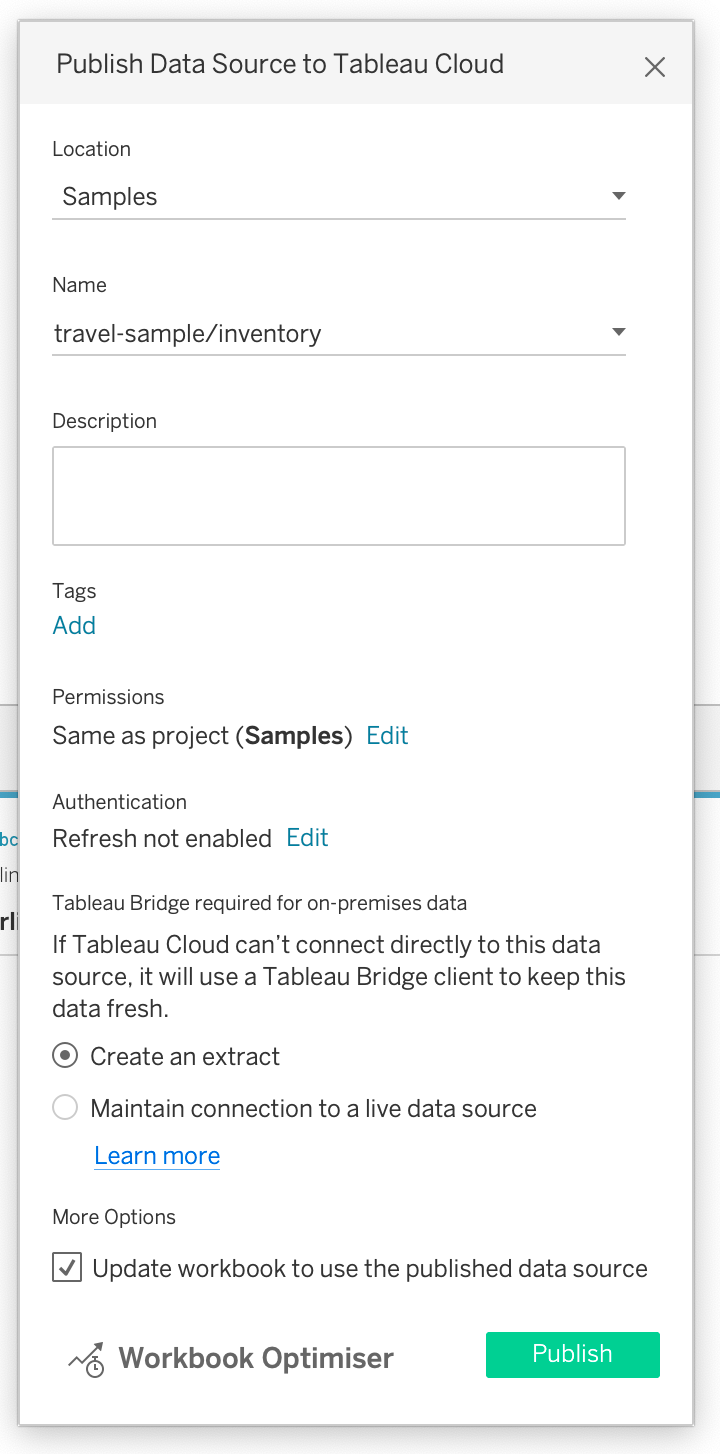
Select the project to publish to and give the data source a name and hit Publish.
Once successfully configured, you will receive a notification on Tableau Server. Here you will be prompted to log in to Tableau Server again.
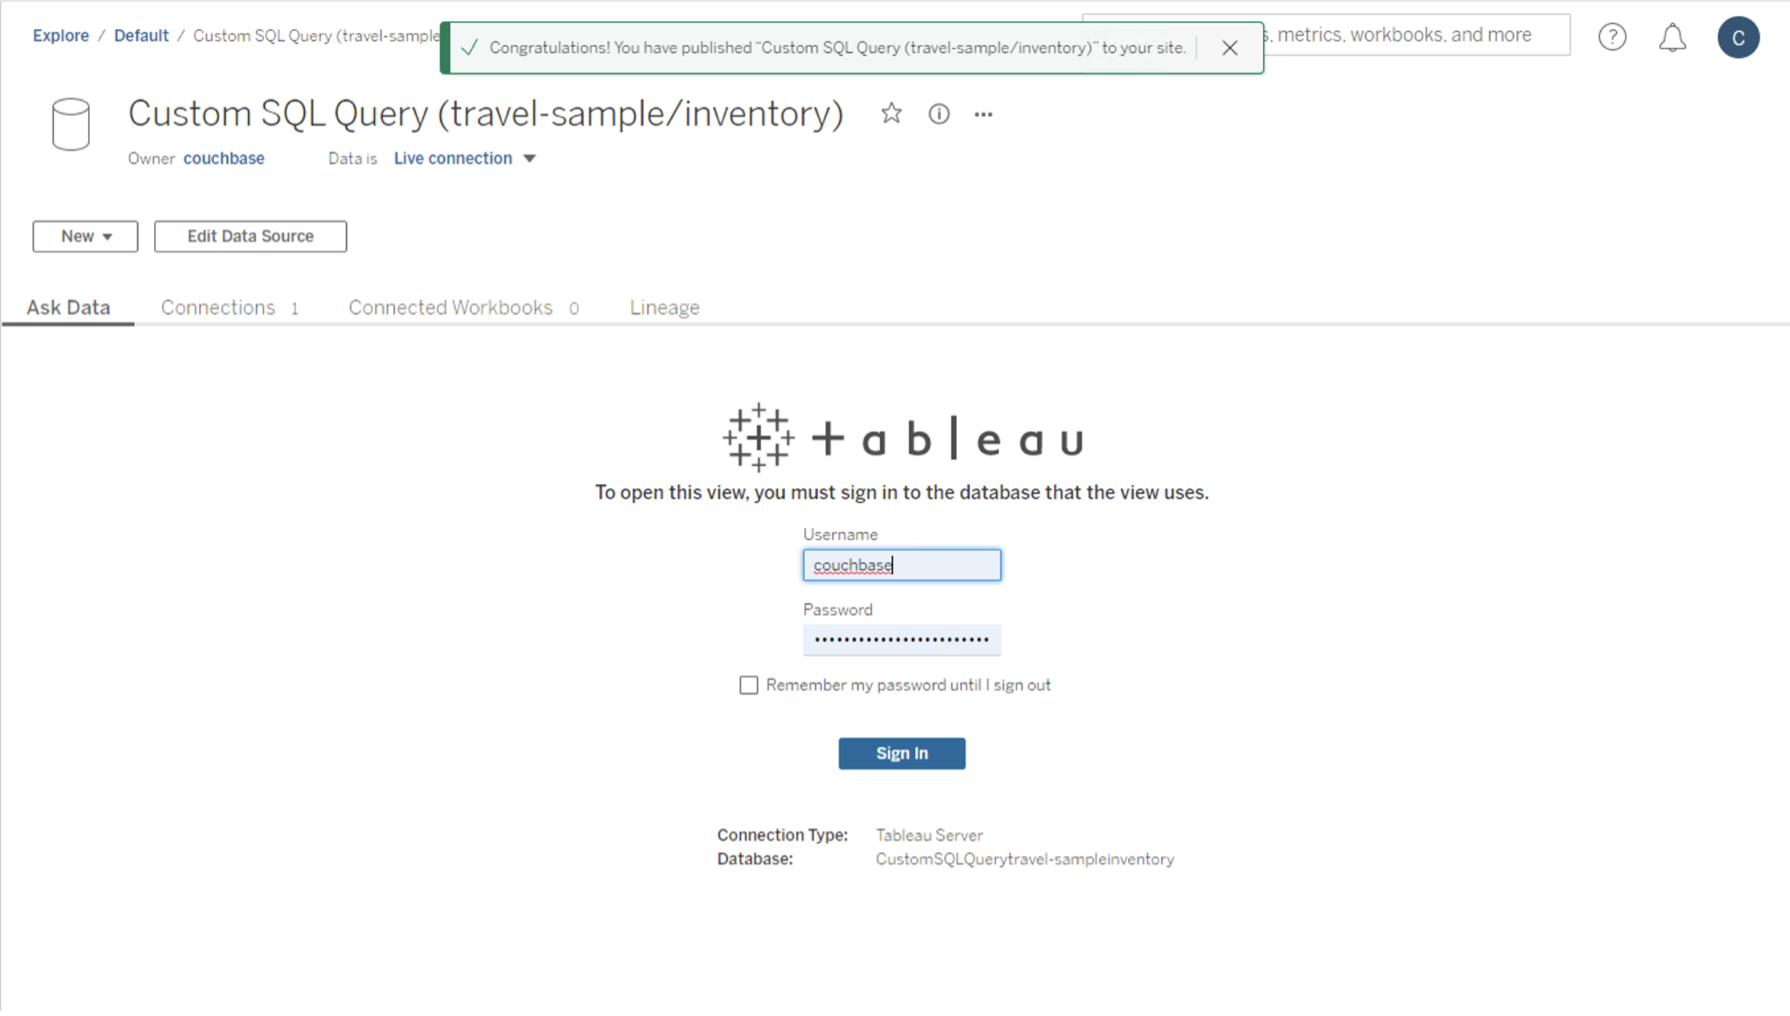
Once logged in you should be able to see your data source. Using the data source you can then create your own workbooks and reports that use the data source set up by Tableau Server.