View and Analyze Data in Tableau
- how-to
View and analyze data from Couchbase data sources using Tableau.
Prerequisites
Before you can view and analyze Couchbase data in Tableau, you must:
-
Create Tabular Analytics Views from your Couchbase datasets for use with Tableau. For more information, see Couchbase Analytics Tabular Views.
-
Configure the connection between Tableau and your Couchbase data source. For more information, see Configure the Connection.
View Data from Analytic Views
After Tableau connects to your Couchbase data source, the connection appears in the Connections section. The scopes defined when you set up the connection appear under Scopes. The Collections section lists collections based on your tabular analytics views.
To view the data for a specific view, drag and drop the view onto the data pane. This displays the data in a tabular format.
Use Analytics Views to Build Tableau Worksheets
After setting up your Couchbase Analytics Tabular views, use them as a data source to build a Tableau worksheet.
-
From the Data Source pane, drag and drop the airline_view onto the data pane.
This brings up two views. The first view shows details about the view, including the mapping from the view column names to their corresponding document fields.
-
Select Sheet1. This sheet opens and displays individual columns from the view, along with a subset of columns called Measure Values.
-
Drag the City column on to the Rows section to add cities to the sheet.
-
Drag Airport Name to the columns section.
-
Select the drop-down on Airport Name and select . This creates a simple bar graph that shows the number of airports for each city.
You can also filter your results by using the Filters section.
-
Drag and drop the Country field into the Filters section.
-
Select the country you want to filter by. For example, selecting France filters out cities from other countries.
Depending on the view you’re using and the type of report you want to build, you can also select how the data is plotted by choosing one of the options in the Marks drop-down.
Use Analytics Queries to Build Tableau Worksheets
In addition to using predefined views or custom views, you can use Analytics queries as a data source.
To use Analytics queries, go to the Data Source tab and select New Custom SQL. Here you can submit queries through the Tableau Connector/JDBC driver that run in a special SQL-compatible mode where certain language constructs operate differently from the regular SQL++ execution.
The default scope is set based on the scope specified in the connection dialog.
If no scope is explicitly mentioned, it’s set to Default.
However, users can provide any other scope when setting up the connection.
To run Analytics queries, you may specify the Analytics scope along with the collection in your queries.
If no scope is specified in a query, the scope set in the connection dialog will be used.
For example, to use the airline Analytics collection, use `travel-sample`.inventory.airline.
|
Run Analytics Queries on Tableau
A simple Analytics query you can execute is to get the counts of the hotels per city. In the Edit Custom SQL window, add the following query and select Preview Results.
select
 country,
 city,
 count(id) as count
from `travel-sample`.inventory.hotel
group by country, city
order by count(id) desc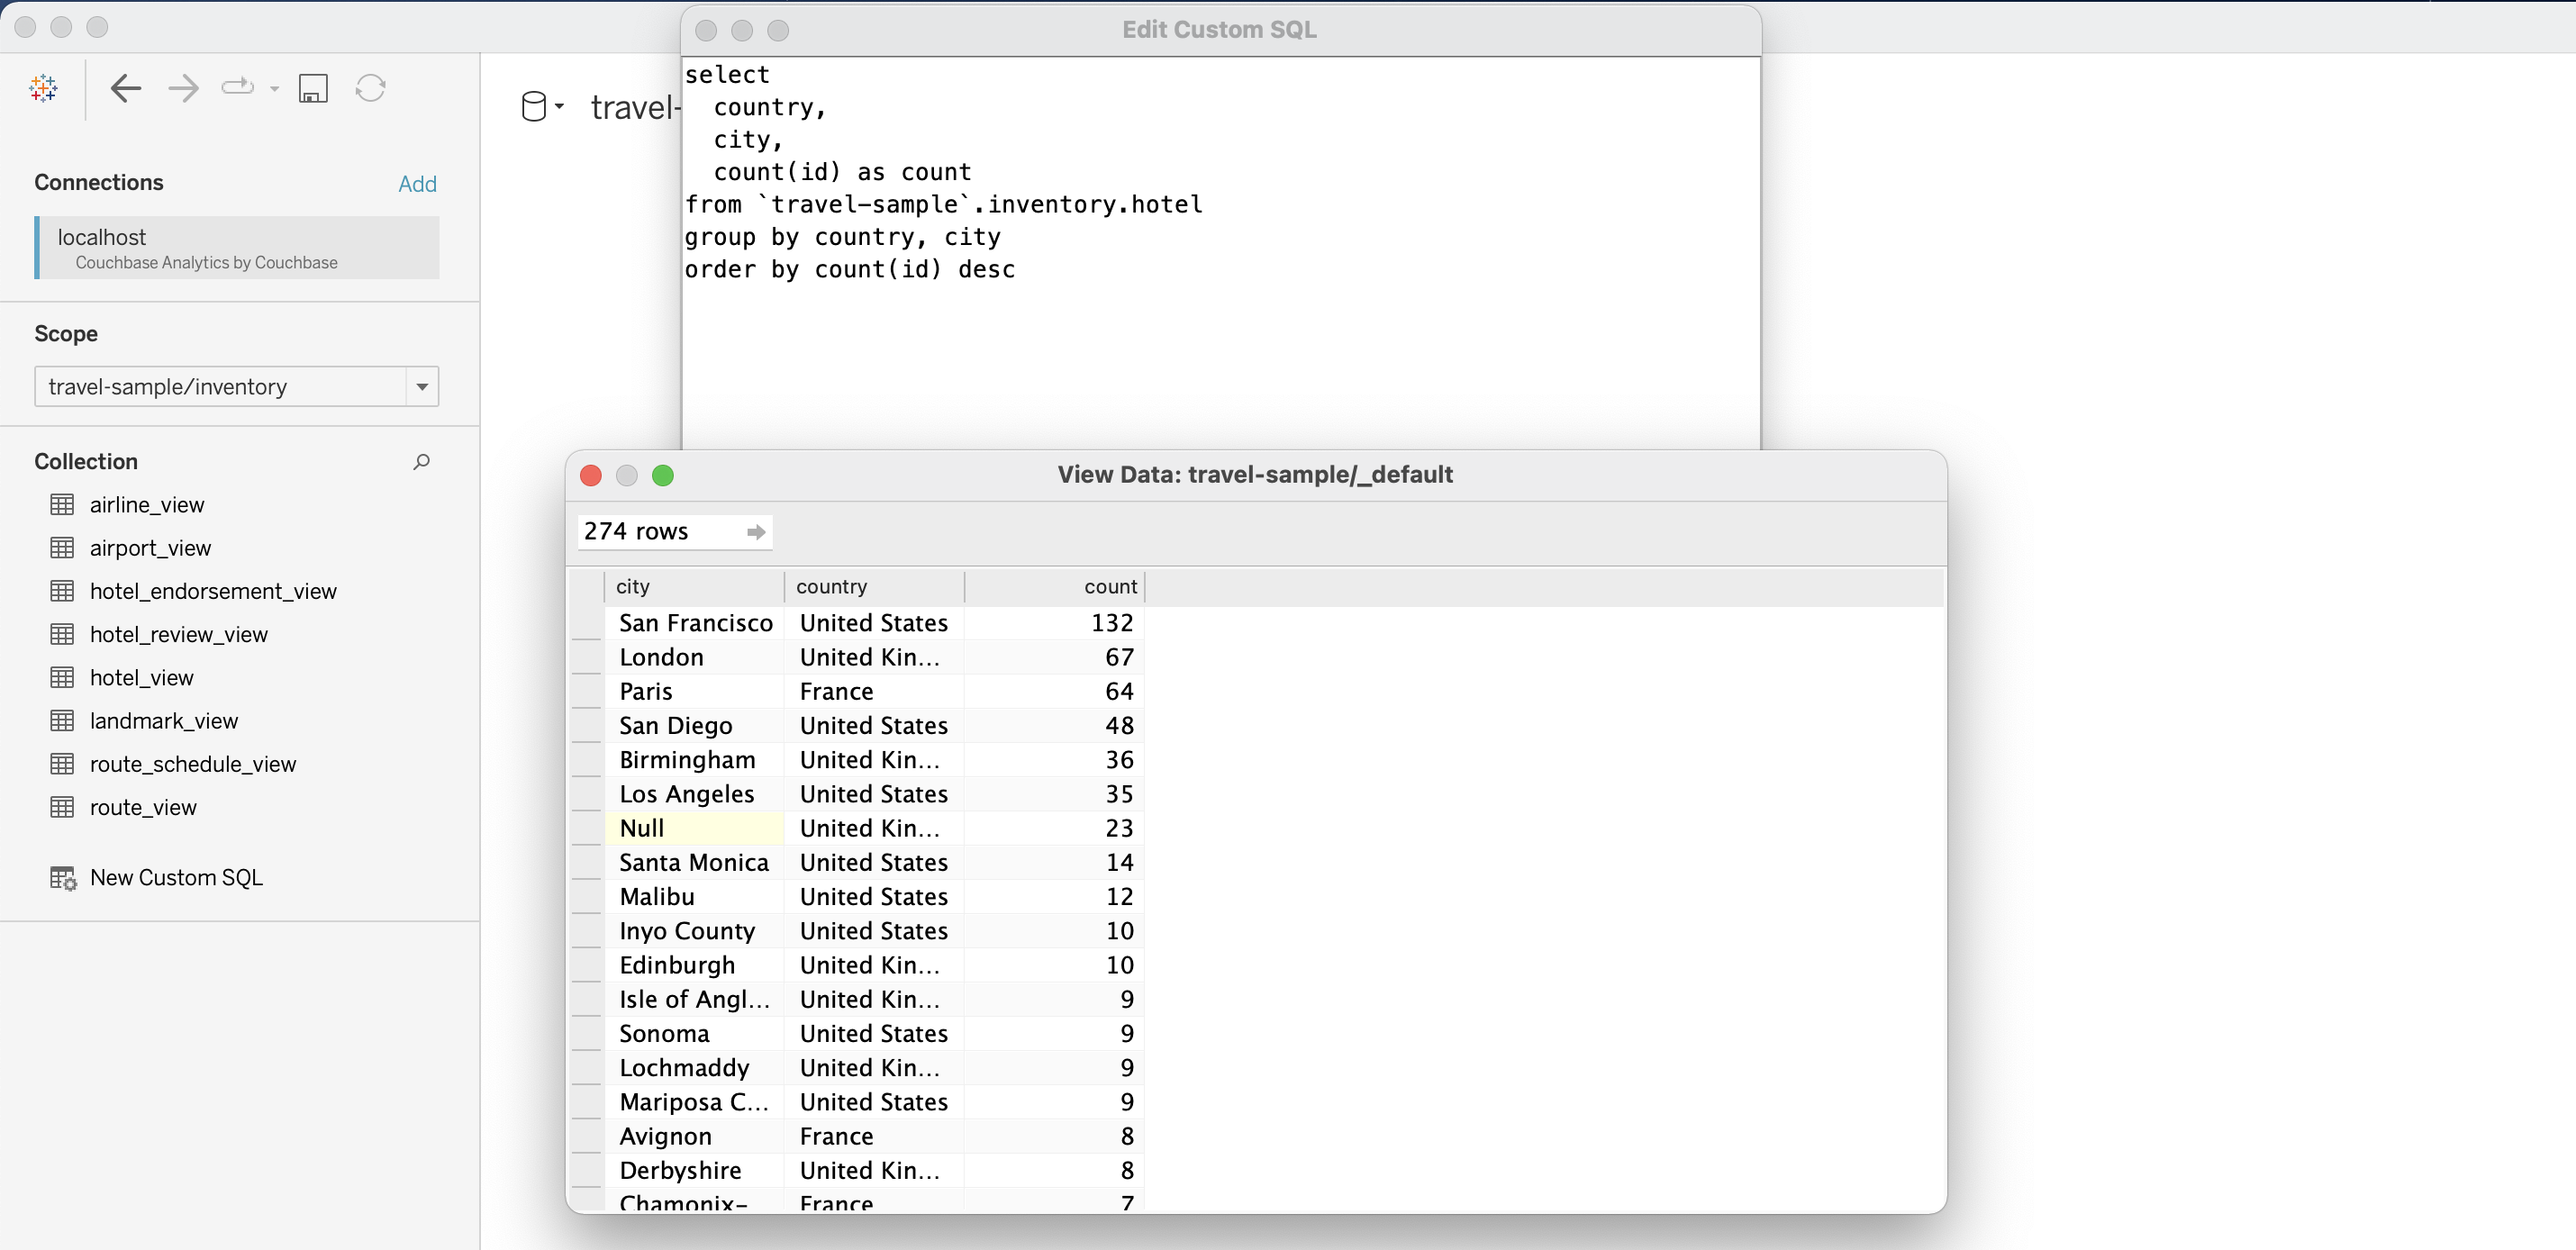
You can also use queries that join multiple Analytics collections. For example, to get the airlines with the most routes you can run the following query.
select a.id,
 a.callsign,
 a.name,
 a.country,
 count(r.id) as route_count
from `travel-sample`.inventory.airline a
join `travel-sample`.inventory.route r on META(a).id = r.airlineid
group by a.id, a.callsign, a.name, a.country
order by route_count desc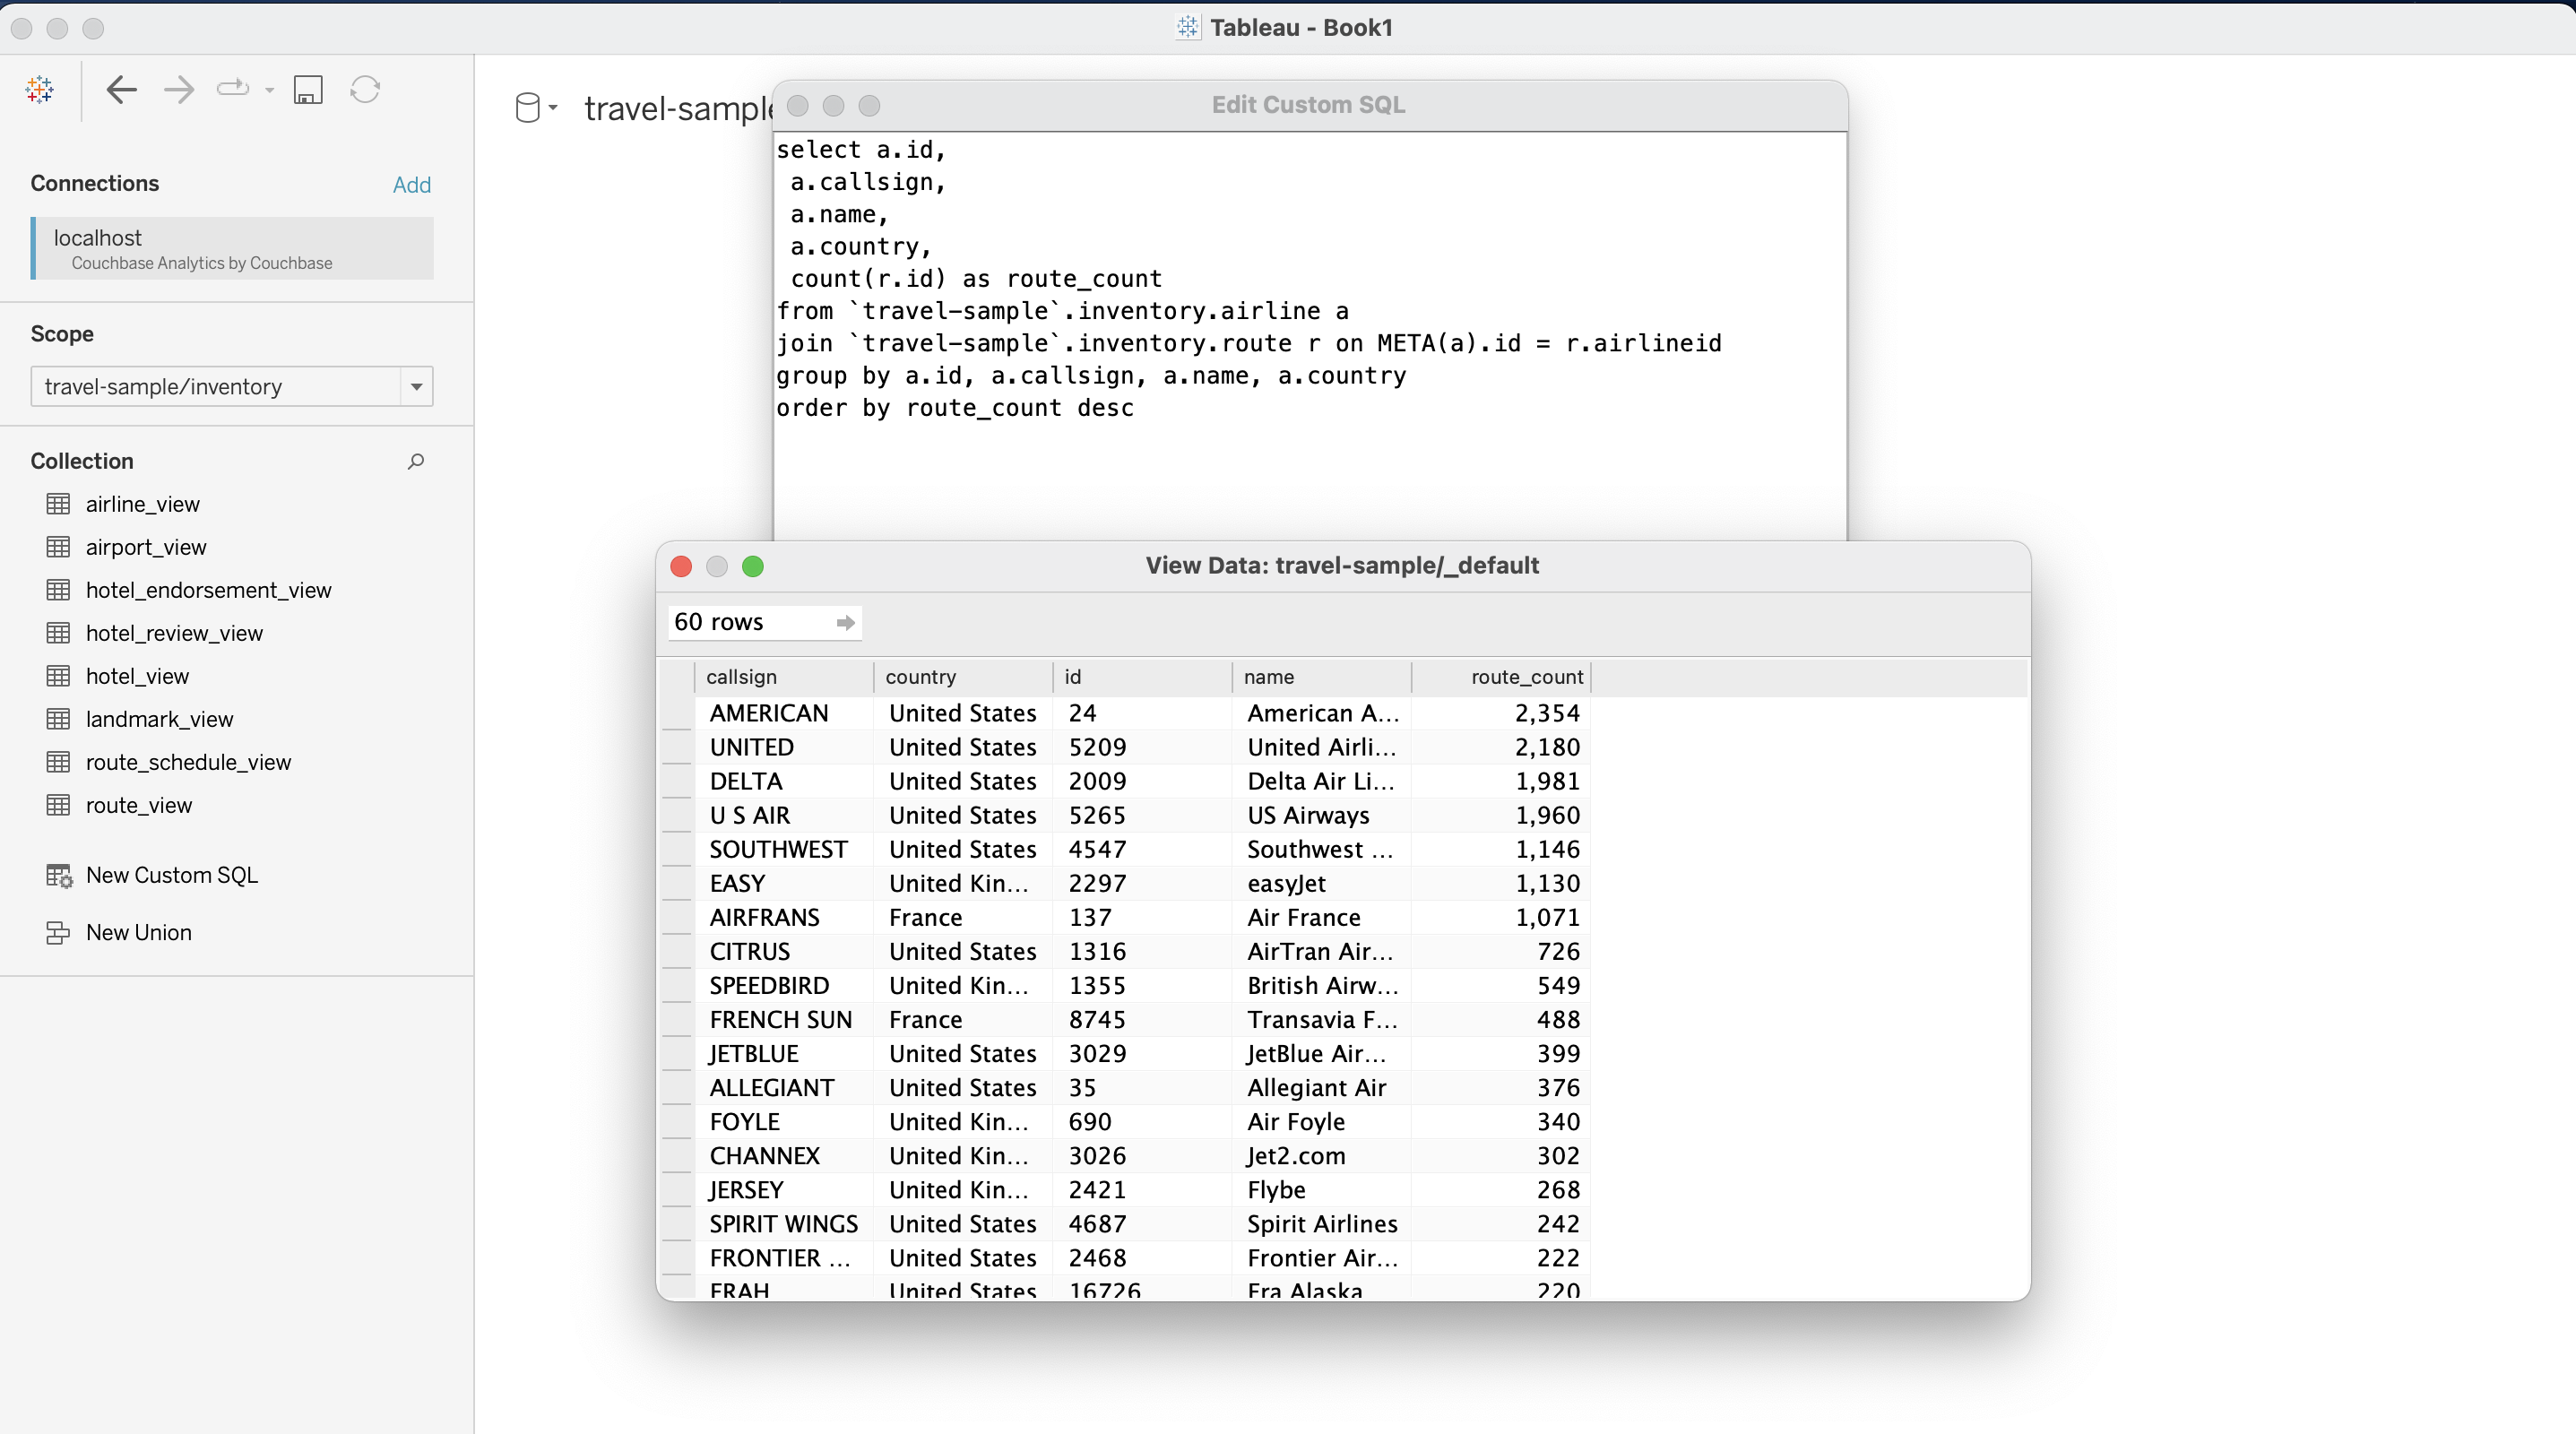
The previous query can be expanded upon further by getting the percentile rank of airlines with the most routes with the following query.
select
 a.id,
 a.callsign,
 a.name,
 a.country,
 count(r.id) as route_count,
 PERCENT_RANK() OVER (
  ORDER BY count(r.id)
  ) AS `rank`
from `travel-sample`.inventory.airline a
join `travel-sample`.inventory.route r on META(a).id = r.airlineid
group by a.id, a.callsign, a.name, a.country
order by route_count desc
limit 100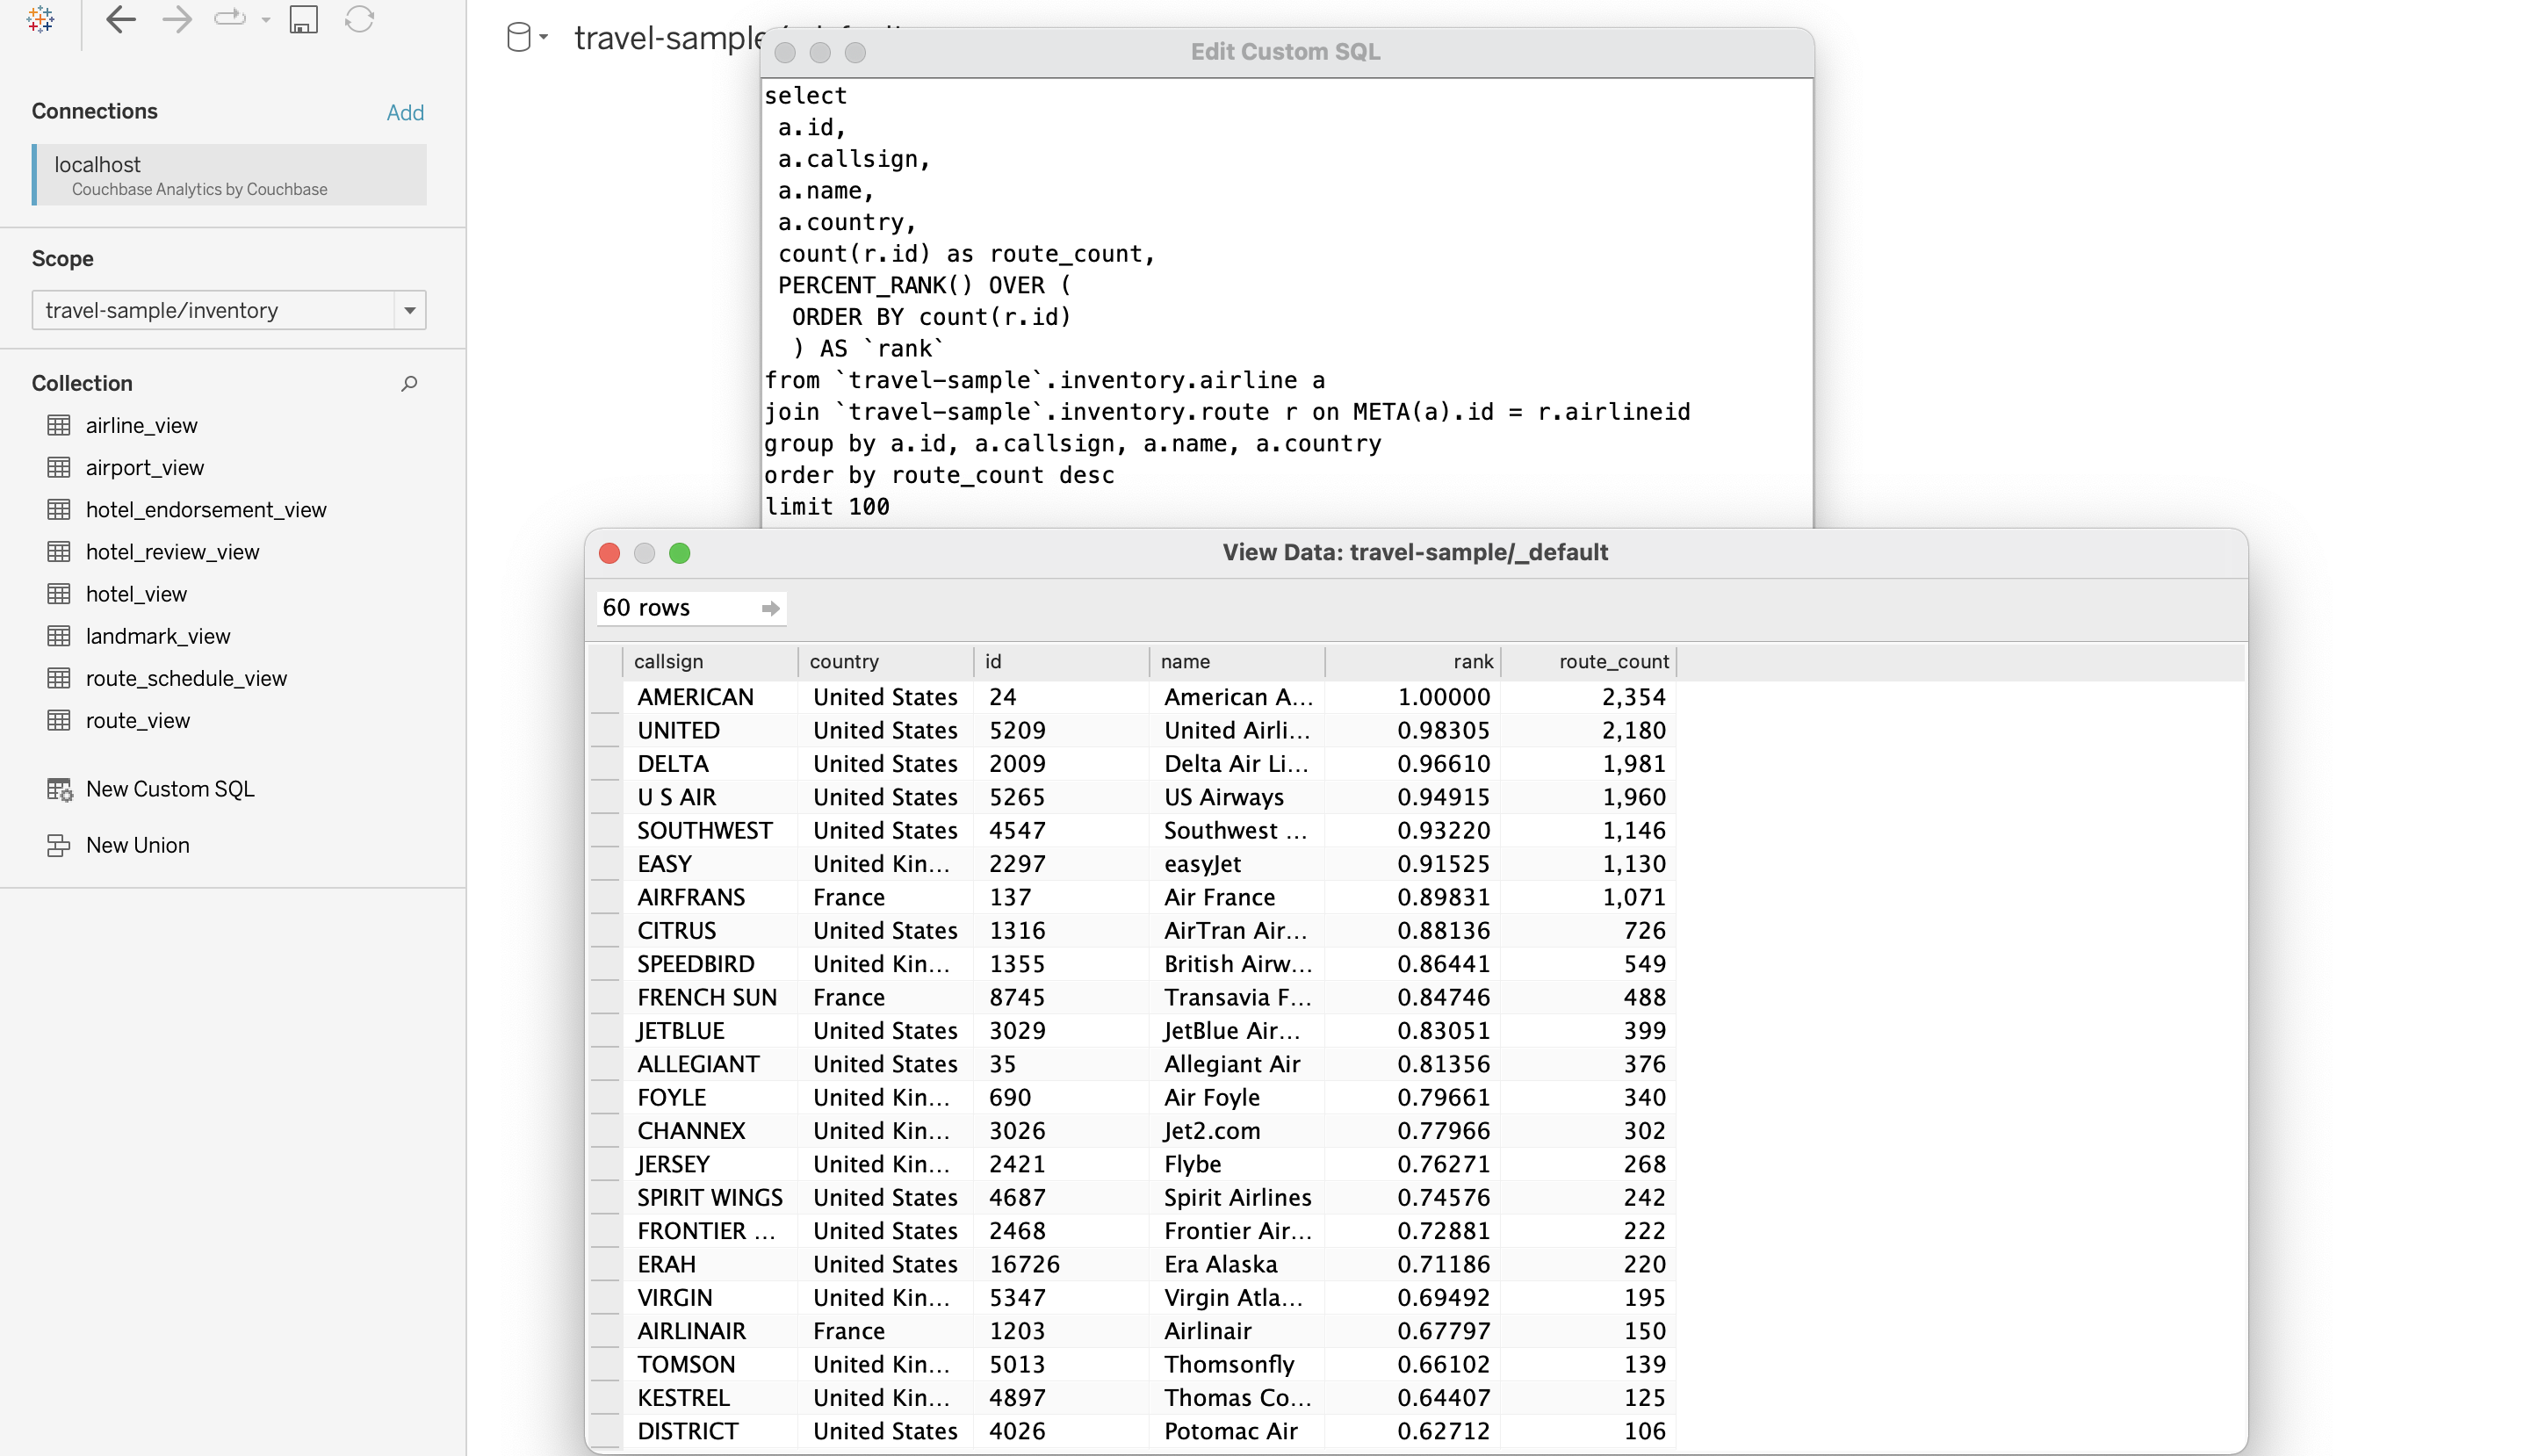
Use Analytics Queries as the Data Source to Build Tableau Reports
After you execute your query, you can see the data from the query in a tabular form.
-
Go to the Sheet tab.
-
Add the name field to Rows and the rank field to Columns.
-
Click the rank label on the graph and choose descending to order the chart from highest to lowest.
Publish Workbook to Tableau Server
Follow these steps to publish a workbook from Tableau Desktop to Tableau Server:
-
From the menu, choose .
-
Select the project and enter a name for the workbook.
-
Configure any publish options, then click Publish.
-
After publishing, your web browser opens and prompts you to sign in to Tableau Server.
-
Sign in with your Tableau Server account.
After signing in, open the workbook on Tableau Server to:
-
View the report in detail.
-
Refresh the workbook data to load any updates from the source.
Publish Data Sources to Tableau Server
Publish a data source from Tableau Desktop so other users can build workbooks from it on Tableau Server.
To publish a data source:
-
In Tableau Desktop, choose .
-
Select the project, enter a name for the data source, and configure any publish options.
-
Click Publish.
After publishing, your browser opens and prompts you to sign in to Tableau Server. Sign in with your Tableau Server account. After you sign in, the published data source appears in the selected project on Tableau Server. Users with access to that project can then open the data source to create workbooks and reports as needed.