Grafana
- Developer Preview
Grafana helps visualize Couchbase metrics, logs, and alerts.
Overview
Grafana is a multi-platform open source monitoring and visualization tool for large scale cloud-native projects.
In any production environment either deployed in the private or public cloud with distributed services it is essential to proactively monitor and visualize the state of the system at all times. As part of the Couchbase Monitoring and Observability Stack (CMOS), Grafana has a set of dashboards that allow administrators to query the state of the system centrally and take action at any given time.
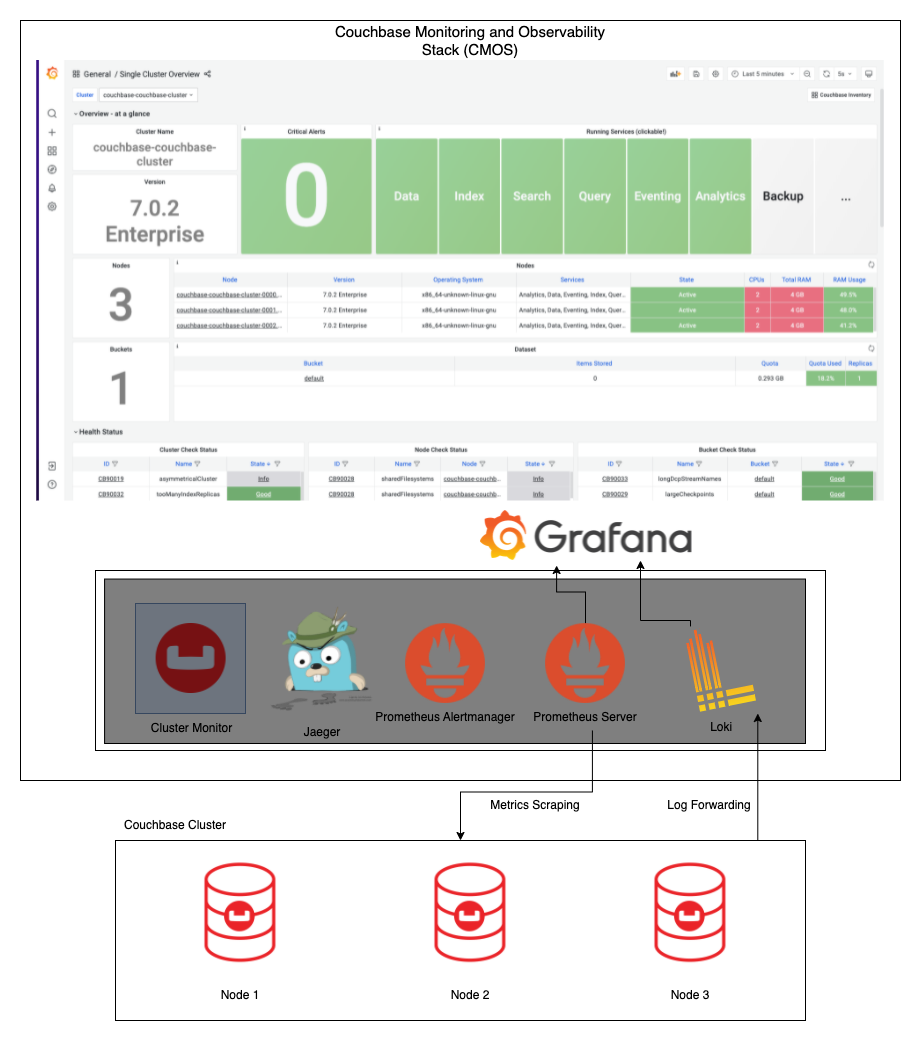
In CMOS, Grafana is linked to data sources such as Prometheus and Loki. Prometheus scrapes couchbase metrics and stores these data points in the prometheus server. Using dashboards in Grafana, users can visualize metrics from the Prometheus server. Logs from Couchbase are sent to Loki, and then exposed in the Grafana dashboards.
Get Started
Grafana is included and enabled by default in the CMOS stack. It ships with a default set of standard dashboards, allowing administrators to quickly and easily get started. Grafana in CMOS can be deployed on premise or using kubernetes. Check out the reference Couchbase Monitoring Observability Stack(CMOS) architecture to learn more. Learn more about how to further customize Grafana dashboards in CMOS: additional dashboards.
Links
-
On Premise Tutorial: Deploy CMOS on Premise
-
Kubernetes Tutorial: Deploy CMOS on Kubernetes
-
Grafana: Creating custom dashboards