Configure CMOS for Kubernetes deployment
- Developer Preview
|
Tutorials are provided to demonstrate how a particular problem may be solved. Tutorials are accurate at the time of writing but rely heavily on third party software. The third party software is not directly supported by Couchbase. For further help in the event of a problem, contact the relevant software maintainer. |
Overview
Couchbase Monitoring and Observability Stack (also known as CMOS) is a simple, out-of-the-box solution built using industry standard tooling to observe the state of a running Couchbase cluster. CMOS can be deployed to monitor the Couchbase clusters deployed via Couchbase Autonomous Operator (CAO) running on Kubernetes.
Deploy CMOS
CMOS is deployed on Kubernetes platform using a standard set of resources like Deployment, Services etc. The following sections describe how to deploy these standard objects. They also include information on configuring these services.
Prometheus Configuration
The prometheus configuration file is a standard way of specifying the configuration for the prometheus server.
Prometheus configuration can be externalized using a Kubernetes ConfigMap, which contains all the details including credentials, and targets to scrape metrics.
By externalizing Prometheus configuration to a Kubernetes config map, you don’t have to build the Prometheus image whenever you need to add or remove a configuration.
You simply need to update the config map and restart the Prometheus pods to apply the new configuration.
The following is an example file that contains default configuration for CMOS prometheus to work out of the box. Run the below command in the console to create it.
mkdir -p ./prometheus/custom/alerting
cat <<EOF >./prometheus/custom/prometheus-k8s.yml
# This is a template file we use so we can substitute environment variables at launch
global:
    scrape_interval: 30s
    evaluation_interval: 30s
  # scrape_timeout is set to the global default (10s).

  # Attach these labels to any time series or alerts when communicating with
  # external systems (federation, remote storage, Alertmanager).
    external_labels:
        monitor: couchbase-observability-stack

# Load and evaluate rules in this file every 'evaluation_interval' seconds.
rule_files:
  # All Couchbase default rules go here
    - /etc/prometheus/alerting/couchbase/*.yaml
    - /etc/prometheus/alerting/couchbase/*.yml
  # All custom rules can go here: relative to this file
    - alerting/*.yaml
    - alerting/*.yml

alerting:
    alertmanagers:
        - scheme: http
    # tls_config:
    #   ca_file: /var/run/secrets/kubernetes.io/serviceaccount/ca.crt
    # bearer_token_file: /var/run/secrets/kubernetes.io/serviceaccount/token
          path_prefix: /alertmanager/
    # Assumption is we always have AlertManager with Prometheus
          static_configs:
              - targets:
                    - localhost:9093
    # Discover alert manager instances using K8s service discovery
    # kubernetes_sd_configs:
    #   - role: pod
    # relabel_configs:
    # - source_labels: [__meta_kubernetes_namespace]
    #   regex: monitoring
    #   action: keep
    # - source_labels: [__meta_kubernetes_pod_label_app]
    #   regex: prometheus
    #   action: keep
    # - source_labels: [__meta_kubernetes_pod_label_component]
    #   regex: alertmanager
    #   action: keep
    # - source_labels: [__meta_kubernetes_pod_container_port_number]
    #   regex:
    #   action: drop

scrape_configs:
    - job_name: prometheus
      metrics_path: /prometheus/metrics
      static_configs:
          - targets: [localhost:9090]

    - job_name: couchbase-grafana
      file_sd_configs:
          - files:
                - /etc/prometheus/couchbase/monitoring/*.json
            refresh_interval: 30s

  # TODO: add unauthenticated endpoint
    - job_name: couchbase-cluster-monitor
      basic_auth:
          username: admin
          password: password
      metrics_path: /api/v1/_prometheus
    # For basic auth we cannot use file_sd
      static_configs:
          - targets: [localhost:7196]

  # Used for kubernetes deployment as we can discover the end points to scrape from the API
    - job_name: couchbase-kubernetes-pods
      # Server 7 requires authentication
      basic_auth:
          username: admin
          password: password
      kubernetes_sd_configs:
          - role: pod
      relabel_configs:
      # Scrape pods labelled with app=couchbase and then only port 8091 (server 7), 9091 (exporter) or 2020 (fluent bit)
          - source_labels: [__meta_kubernetes_pod_label_app]
            action: keep
            regex: couchbase
          - source_labels: [__meta_kubernetes_pod_container_port_number]
            action: keep
            regex: (8091|9091|2020)
          - action: labelmap
            regex: __meta_kubernetes_pod_label_(.+)
          - source_labels: [__meta_kubernetes_namespace]
            action: replace
            target_label: kubernetes_namespace
          - source_labels: [__meta_kubernetes_pod_name]
            action: replace
            target_label: kubernetes_pod_name
          - source_labels: [__meta_kubernetes_pod_label_couchbase_cluster]
            action: replace
            target_label: cluster

  # Kube-state-metrics default service to scrape
    - job_name: kube-state-metrics
      static_configs:
          - targets: [kube-state-metrics:8080]
EOF| 1 | rule_files: Prometheus is configured to load rules via rule_files.
You can extend rules by adding rule_files under the alerting/ directory.
Note that the alerting/ directory is a relative path to the prometheus configuration file.
By default the complete path is /etc/prometheus/custom/alerting/.
Refer to the Observability Stack section for volume mounts. |
| 2 | alerting: Alert manager is shipped and enabled by default in the CMOS.
This section has various configurations of alert managers. |
| 3 | scrape_configs: All the targets to scrape metrics are defined here.
This includes prometheus, couchbase-grafana, couchbase-cluster-monitor, couchbase-kubernetes-pods and kube-state-metrics.
We try to discover the couchbase pods using labels. |
Run the below command in kubernetes console to create the prometheus config map from the configuration file:
kubectl create configmap prometheus-config-cmos --from-file=./prometheus/custom/Observability Stack
Kubernetes controls access to its resources using Role Based Access Control (RBAC). In order to monitor the Couchbase cluster, the CMOS deployment must communicate with the cluster and discover it. The example YAML file handles this for you. Create it by running the below command in the kubernetes console.
cat <<EOF | kubectl apply -f -
apiVersion: rbac.authorization.k8s.io/v1
kind: ClusterRole
metadata:
   name: monitoring-endpoints-role
   labels:
       rbac.couchbase.observability.com/aggregate-to-monitoring: 'true'
rules:
   - apiGroups: [''] (1)
     resources: [services, endpoints, pods, secrets]
     verbs: [get, list, watch]
   - apiGroups: [couchbase.com] (2)
     resources: [couchbaseclusters]
     verbs: [get, list, watch]
---
apiVersion: rbac.authorization.k8s.io/v1
kind: ClusterRoleBinding
metadata:
   name: monitoring-role-binding (3)
roleRef:
   kind: ClusterRole
   name: monitoring-endpoints-role
   apiGroup: rbac.authorization.k8s.io
subjects:
   - kind: Group
     name: system:serviceaccounts
     apiGroup: rbac.authorization.k8s.io
EOF
In this configure file, you can see that the cluster role is defined by specifying the following permissions:
| 1 | Access to standard Kubernetes resources: CMOS requires get, list and watch permissions to services, endpoints, pods, secrets resources. |
| 2 | Couchbase Custom Resource Definition: CMOS requires get, list and watch permissions to couchbaseclusters resource. |
| 3 | monitoring-role-binding: This role binding is required to give the permissions created in ClusterRole to the service account of CMOS. |
The actual CMOS workload runs as a Kubernetes deployment along with other supporting services. Create it by running the below command in the Kubernetes console.
cat <<EOF | kubectl apply -f -
apiVersion: apps/v1
kind: Deployment
metadata:
   name: couchbase-grafana
spec:
   selector:
       matchLabels:
           run: couchbase-grafana
   replicas: 1
   template:
       metadata:
           labels:
               run: couchbase-grafana
       spec:
           containers:
               - name: couchbase-grafana
                 image: couchbase/observability-stack
                 ports:
                     - name: http
                       containerPort: 8080
                     - name: loki # So we can push logs to it
                       containerPort: 3100
                 env:
                     - name: KUBERNETES_DEPLOYMENT
                       value: 'true'
                     - name: ENABLE_LOG_TO_FILE
                       value: 'true'
                     - name: PROMETHEUS_CONFIG_FILE
                       value: /etc/prometheus/custom/prometheus-k8s.yml
                     - name: PROMETHEUS_CONFIG_TEMPLATE_FILE
                       value: ignore
                   # - name: DISABLE_LOKI
                   #   value: "true"
                 volumeMounts:
                     - name: prometheus-config-volume
                       mountPath: /etc/prometheus/custom # keep /etc/prometheus for any defaults
     # Now we watch for changes to the volumes and auto-reload the prometheus configuration if seen
               - name: prometheus-config-watcher
                 image: weaveworks/watch:master-9199bf5
                 args: [-v, -t, -p=/etc/prometheus/custom, curl, -X, POST, --fail, -o, '-', -sS, http://localhost:8080/prometheus/-/reload]
                 volumeMounts:
                     - name: prometheus-config-volume
                       mountPath: /etc/prometheus/custom
           volumes:
               - name: prometheus-config-volume
                 configMap:
                     name: prometheus-config-cmos
EOF
After the observability dashboard is deployed, we need to create a service to access CMOS. Create it by running the below command in the kubernetes console.
cat <<EOF | kubectl apply -f -
apiVersion: v1
kind: Service
metadata:
   name: couchbase-grafana-http
   labels:
       run: couchbase-grafana
spec:
   ports:
       - port: 8080 (1)
         protocol: TCP
   selector:
       run: couchbase-grafana
EOF| 1 | The observability monitoring service runs on port 8080 by default. |
Create a service for accessing Loki by running the below command in the kubernetes console.
cat <<EOF | kubectl apply -f -
apiVersion: v1
kind: Service
metadata:
   name: loki
   labels:
       run: couchbase-grafana
spec:
   ports:
       - port: 3100
         protocol: TCP
   selector:
       run: couchbase-grafana
EOF
Deploy Couchbase
The Couchbase Helm chart is used to deploy Couchbase Autonomous Operator and a default configuration for the Couchbase Server pods.
It is easy to get started by using the default configuration values. However, if you want to modify any of the values to meet your specific requirements, please see the section below Helm documentation.
We provide an example to show how to set up log forwarding to CMOS via Kubernetes annotations on the pod.
Execute the below commands to create a helm values file with custom values.
cat <<EOF >custom-values.yaml
cluster:
   logging:
       server:
           enabled: true
           sidecar:
               image: couchbase/fluent-bit:1.2.2
   monitoring:
       prometheus:
           enabled: false # We're using server 7 metrics directly
           image: couchbase/exporter:1.0.6
   security:
       username: admin
       password: password (1)
   servers:
       # We use custom annotations to forward to CMOS Loki
       default:
           size: 3
           pod:
               metadata:
                   annotations:
                       # Match all logs
                       fluentbit.couchbase.com/loki_match: "*"
                       # Send to this SVC
                       fluentbit.couchbase.com/loki_host: loki.default
           volumeMounts:
               default: couchbase
   volumeClaimTemplates:
       - metadata:
             name: couchbase
         spec:
             resources:
                 requests:
                     storage: 1Gi
EOF| 1 | We recommend specifying a stronger password. |
| If you already have the Couchbase operator deployed using helm or are considering a new deployment, the below command can be used with custom values to enable CMOS. If it is deployed using command line tools, you have to update the existing service using the kubectl patch with custom values mentioned above. |
By using the command below, you can upgrade the existing version of an already deployed Couchbase operator. If the operator is not yet installed, it will install it.
Upgrades to an installed version of operator should be handled with extreme caution.
Invalid custom-values.yaml can cause issues in the operator installation.
|
In the command below, the default values can in turn be overridden by a user-supplied values file specified using the --set parameters.
helm repo add couchbase https://couchbase-partners.github.io/helm-charts/
helm upgrade --install couchbase couchbase/couchbase-operator --set cluster.image=couchbase/server:7.0.2 --values=custom-values.yaml
Accessing CMOS
Deploying Ingress
In order to access the cluster, we set up a Kubernetes Ingress to forward traffic from our localhost to the appropriate parts of the cluster.
There are two aspects required here:
-
Provide an Ingress controller, which is Nginx in this case.
-
Set up Ingress to forward to our CMOS service.
For a production system it is likely an Ingress controller will already be deployed with appropriate rules.
Follow this Nginx Ingress Controller guideline to setup it.
As soon as the Ingress controller is installed and ready, the last step is to deploy the Ingress configuration as shown below :.
# Ingress to forward to our web server including sub-paths: we should just forward what we need but for local testing just sending it all.
cat <<EOF | kubectl apply -f -
apiVersion: networking.k8s.io/v1
kind: Ingress
metadata:
name: couchbase-ingress
annotations:
kubernetes.io/ingress.class: nginx
nginx.ingress.kubernetes.io/rewrite-target: /
spec:
rules:
- http:
paths:
- path: /
pathType: Prefix
backend:
service:
name: couchbase-grafana-http
port:
number: 8080
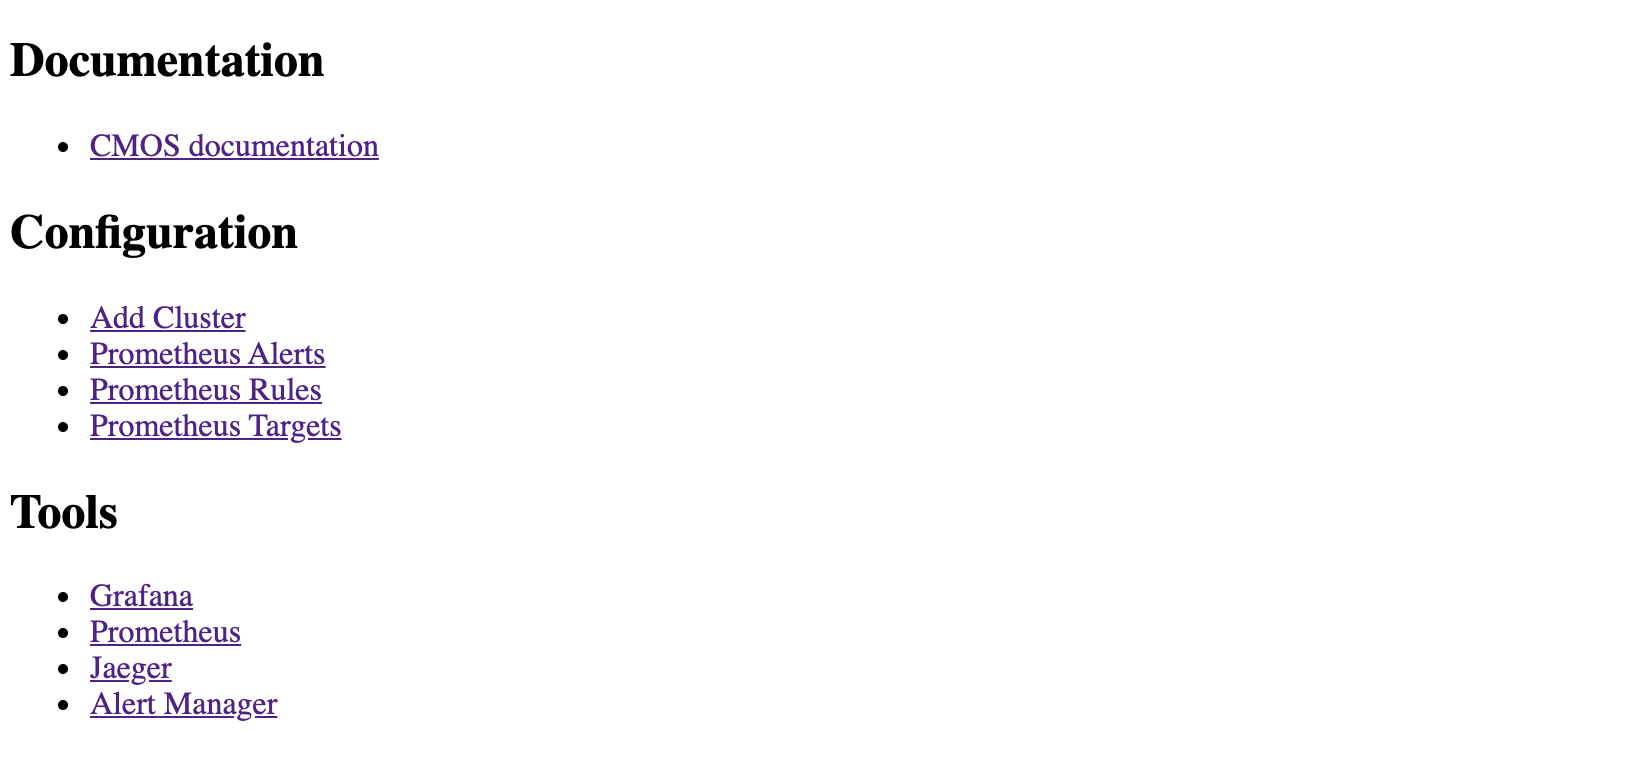
EOFIf everything is deployed properly, you should be able to access http://localhost (or whatever the Ingress* is for your deployment).
You should see a landing page which includes links to documentation, cluster manager service and various other services of CMOS.
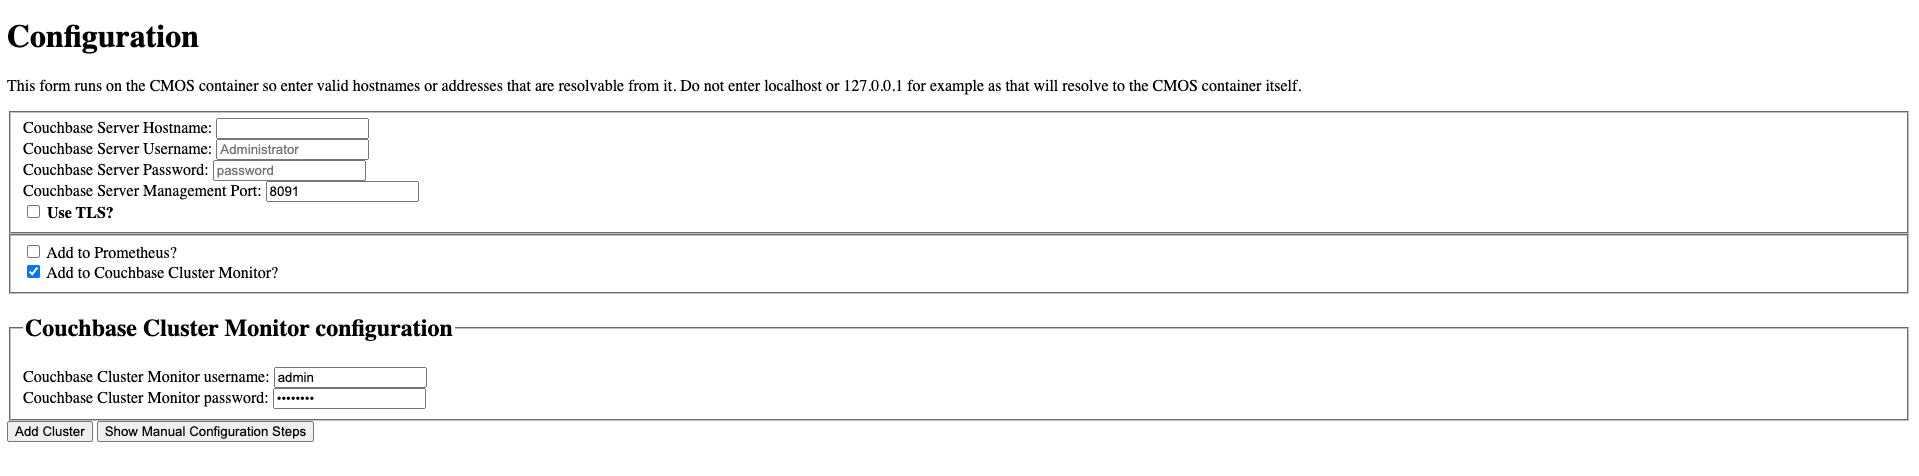
Add Couchbase Cluster
You can access the Couchbase cluster from the CMOS dashboard using the “Add Cluster” option. In this section, we need to enter a few details and then click on "Add Cluster". Enter the Couchbase Server hostname, username and password credentials.
By default the username is “admin” and password is “password”.
We recommend specifying a stronger password in the custom-values.yaml file during CMOS installation.
| Remove the check from “Add to Prometheus” option, because prometheus scraping will be configured using service discovery. |
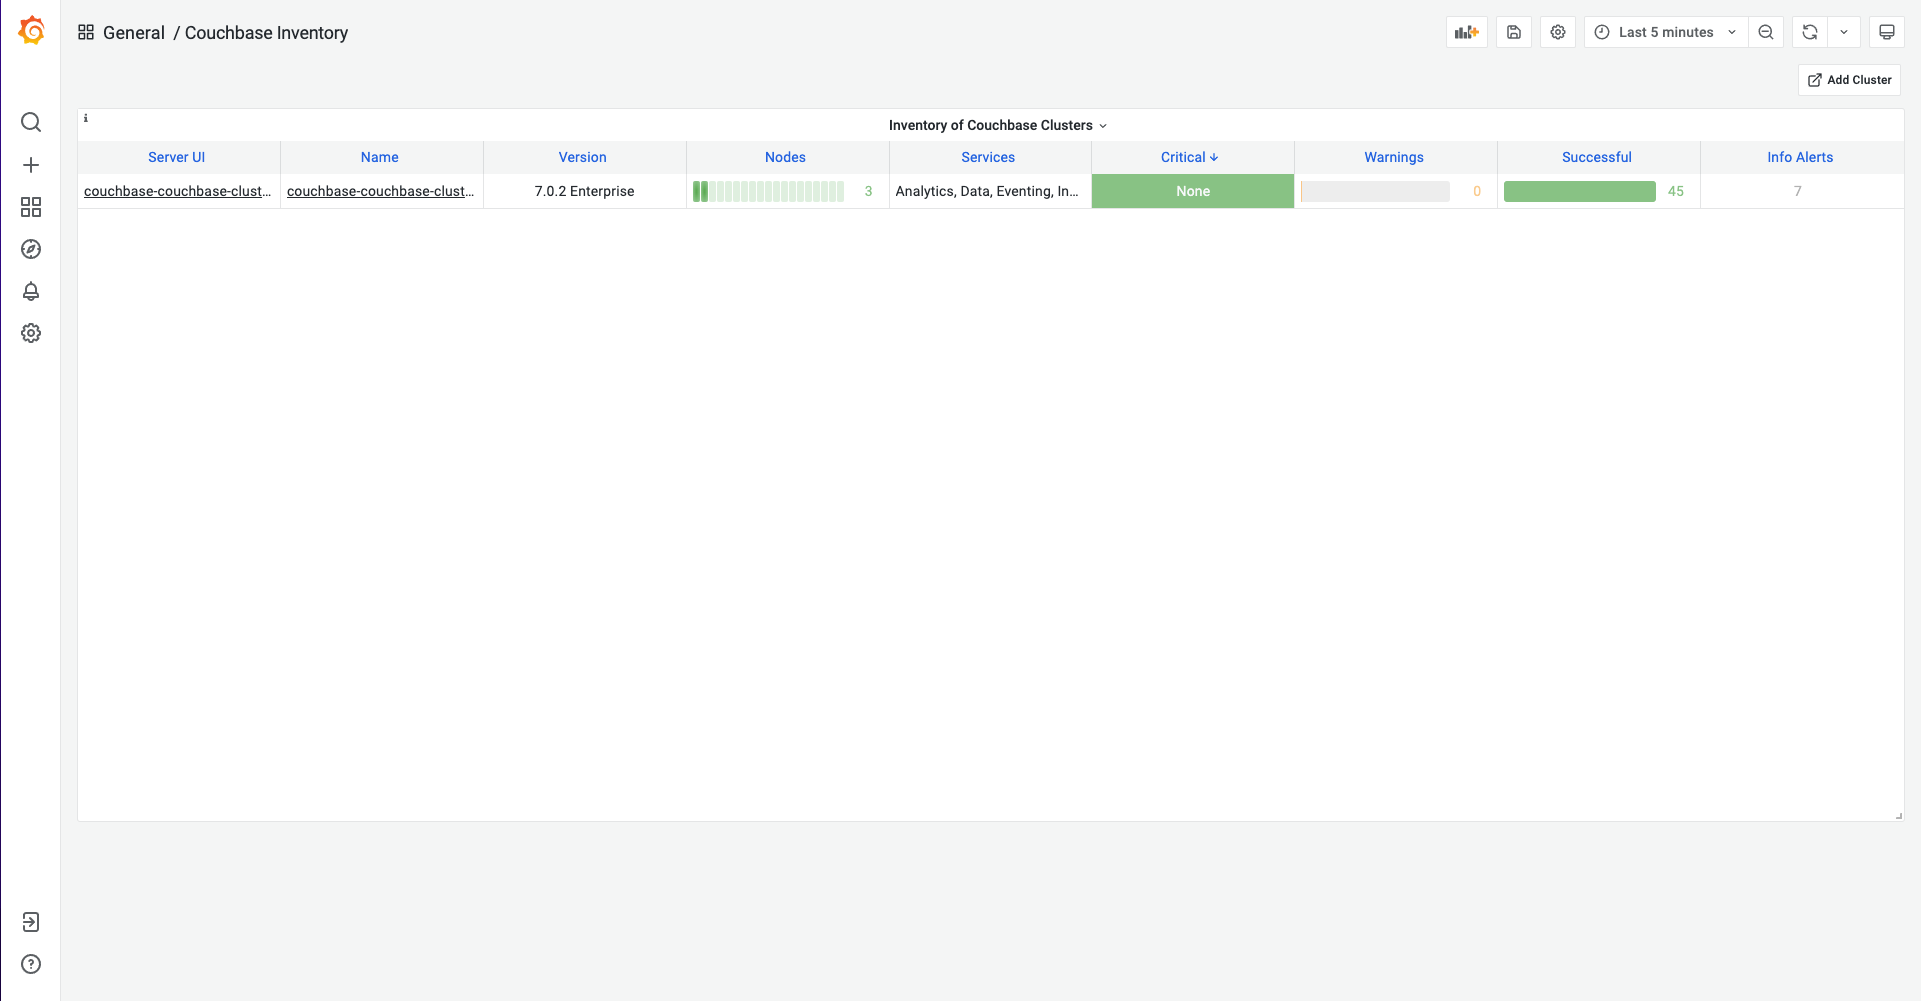
As soon as you add a cluster, you will see a Grafana URL where you can view inventory and metrics of Couchbase server clusters.
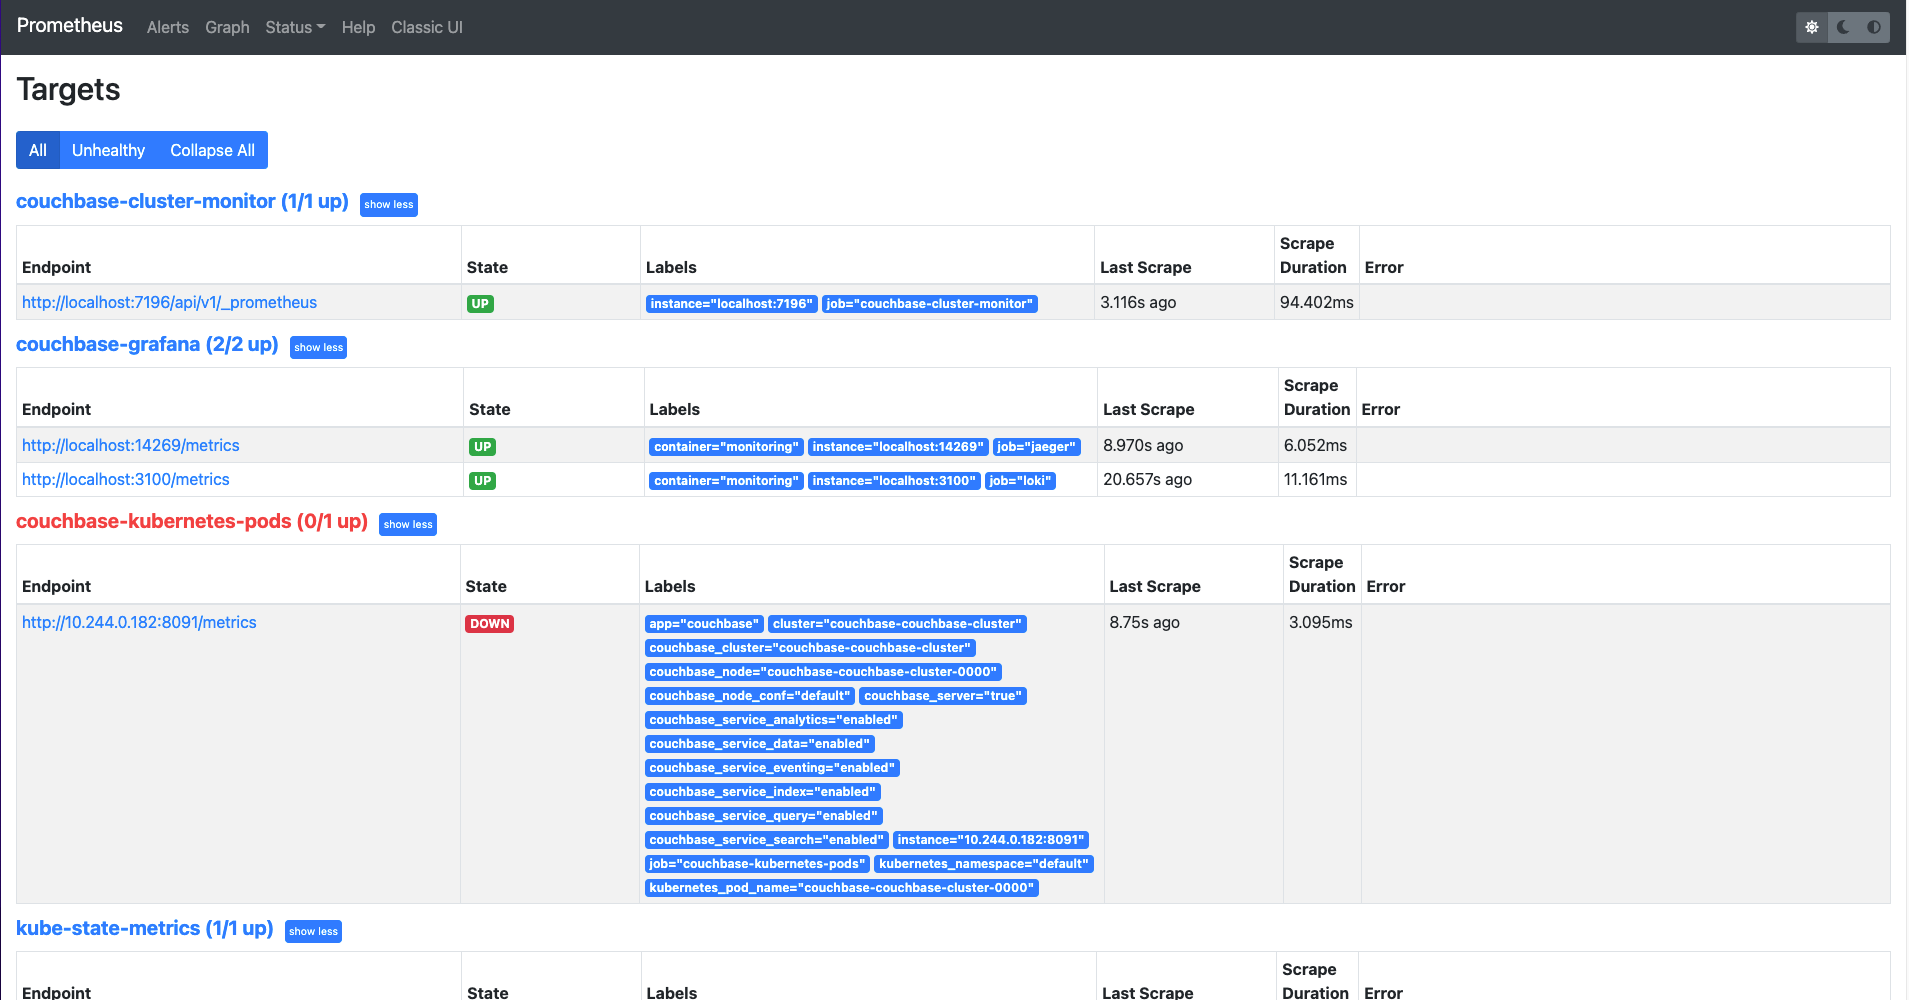
Prometheus Targets
From the "Prometheus Targets" option, we can see the prometheus targets and their details. For instance, we can filter the targets to show all targets or unhealthy targets. The state information tells which prometheus targets are running. The last scrape value shows how long ago the target metrics were scraped.
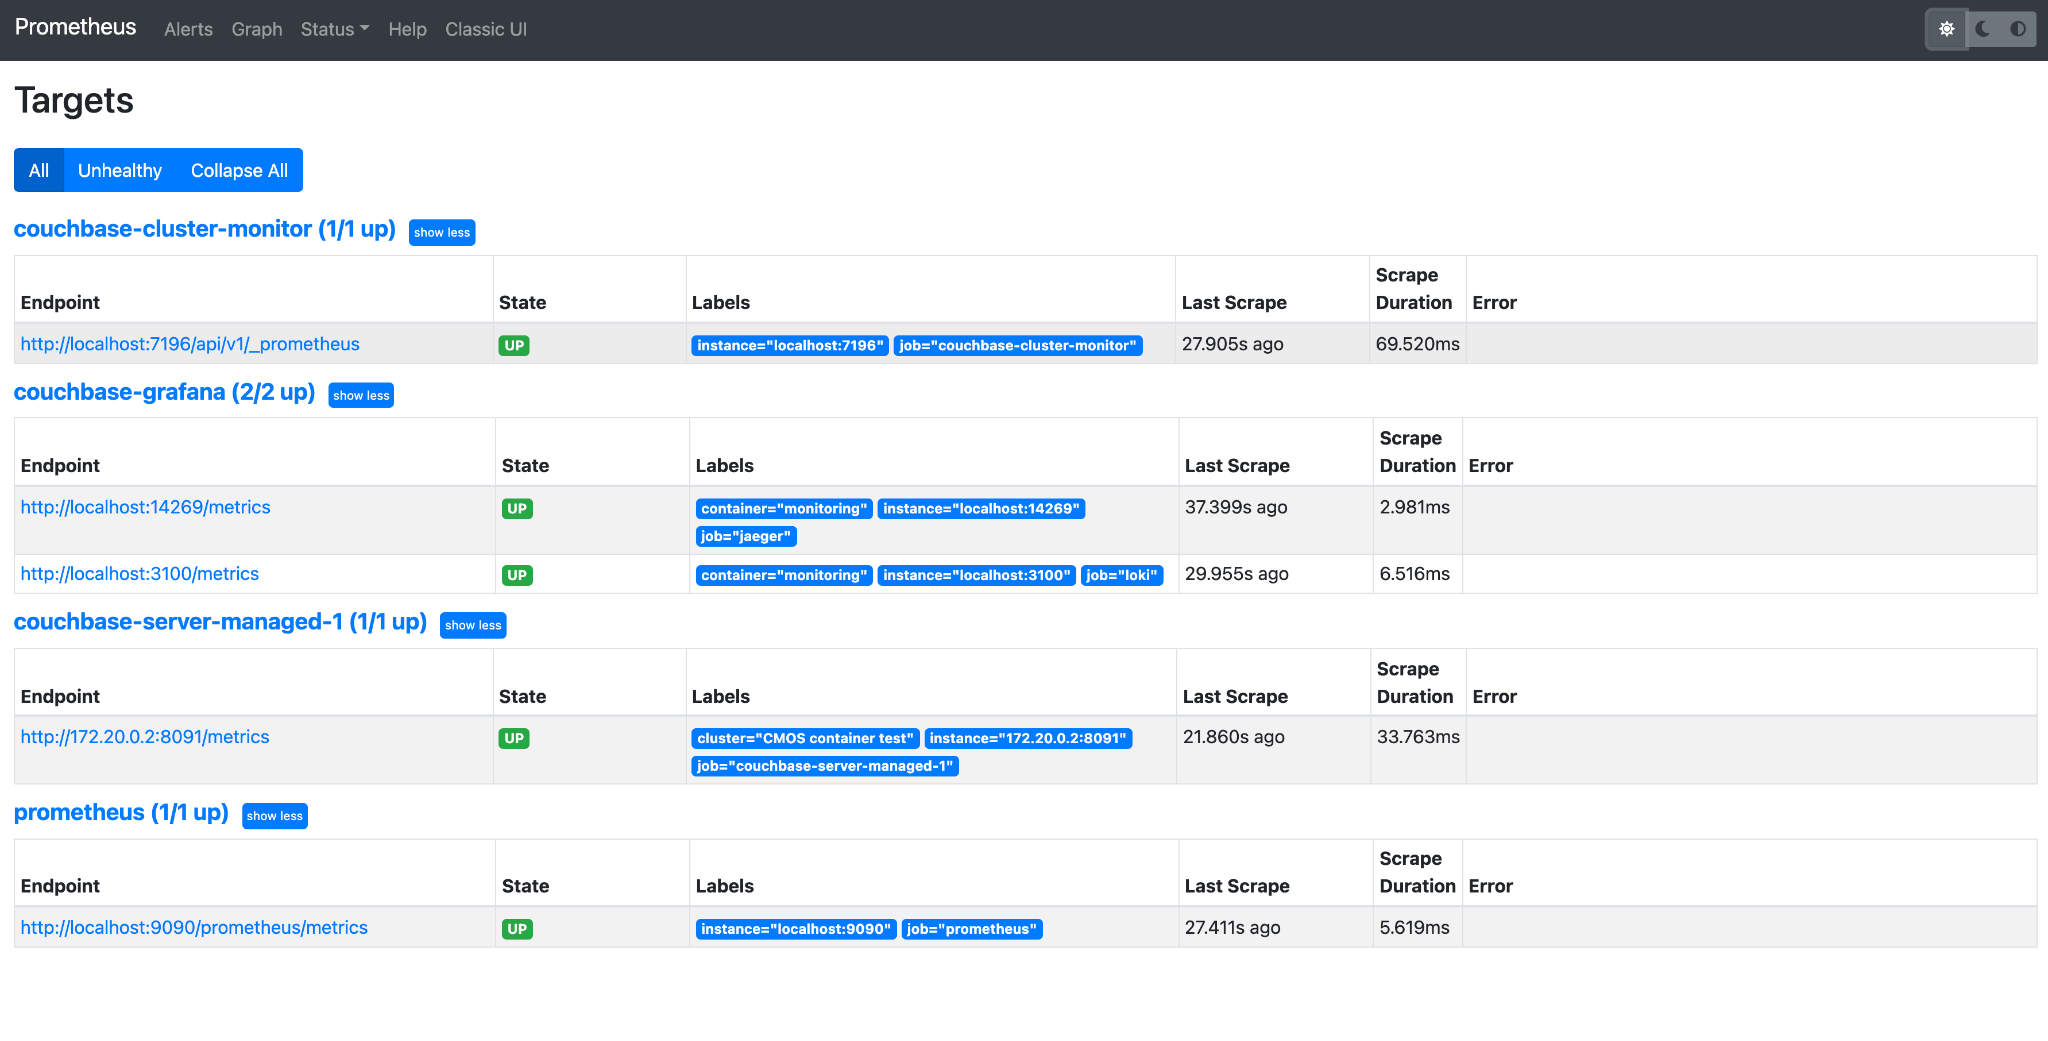
Whilst the pods are coming up, some may report as failing but these will resolve once the pods are running.
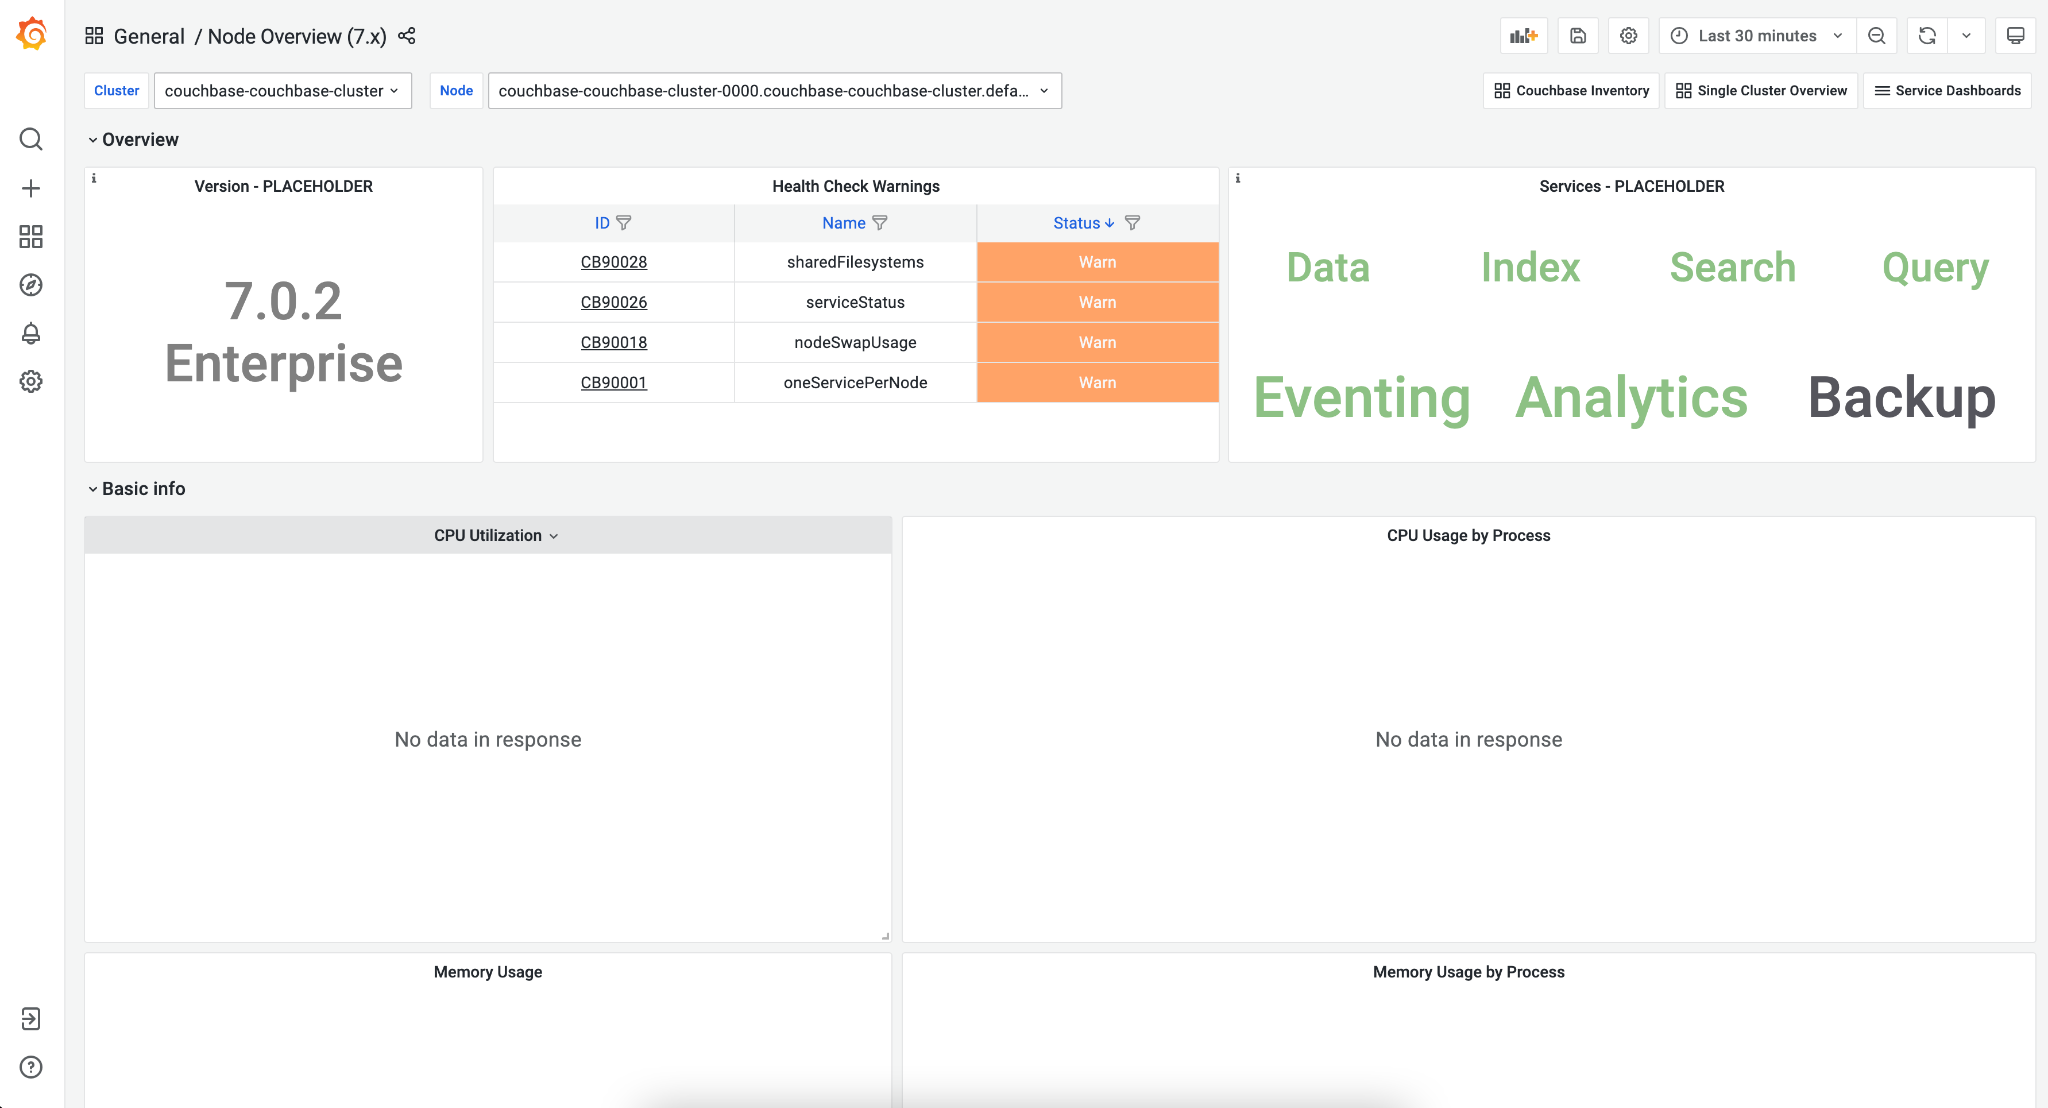
Grafana Dashboard
With Grafana, multiple dashboards for monitoring a Couchbase cluster are provided out of the box. You can list all the dashboards using the search dashboard option. You may create additional dashboards as per your needs. The following are some out-of-the-box dashboards.
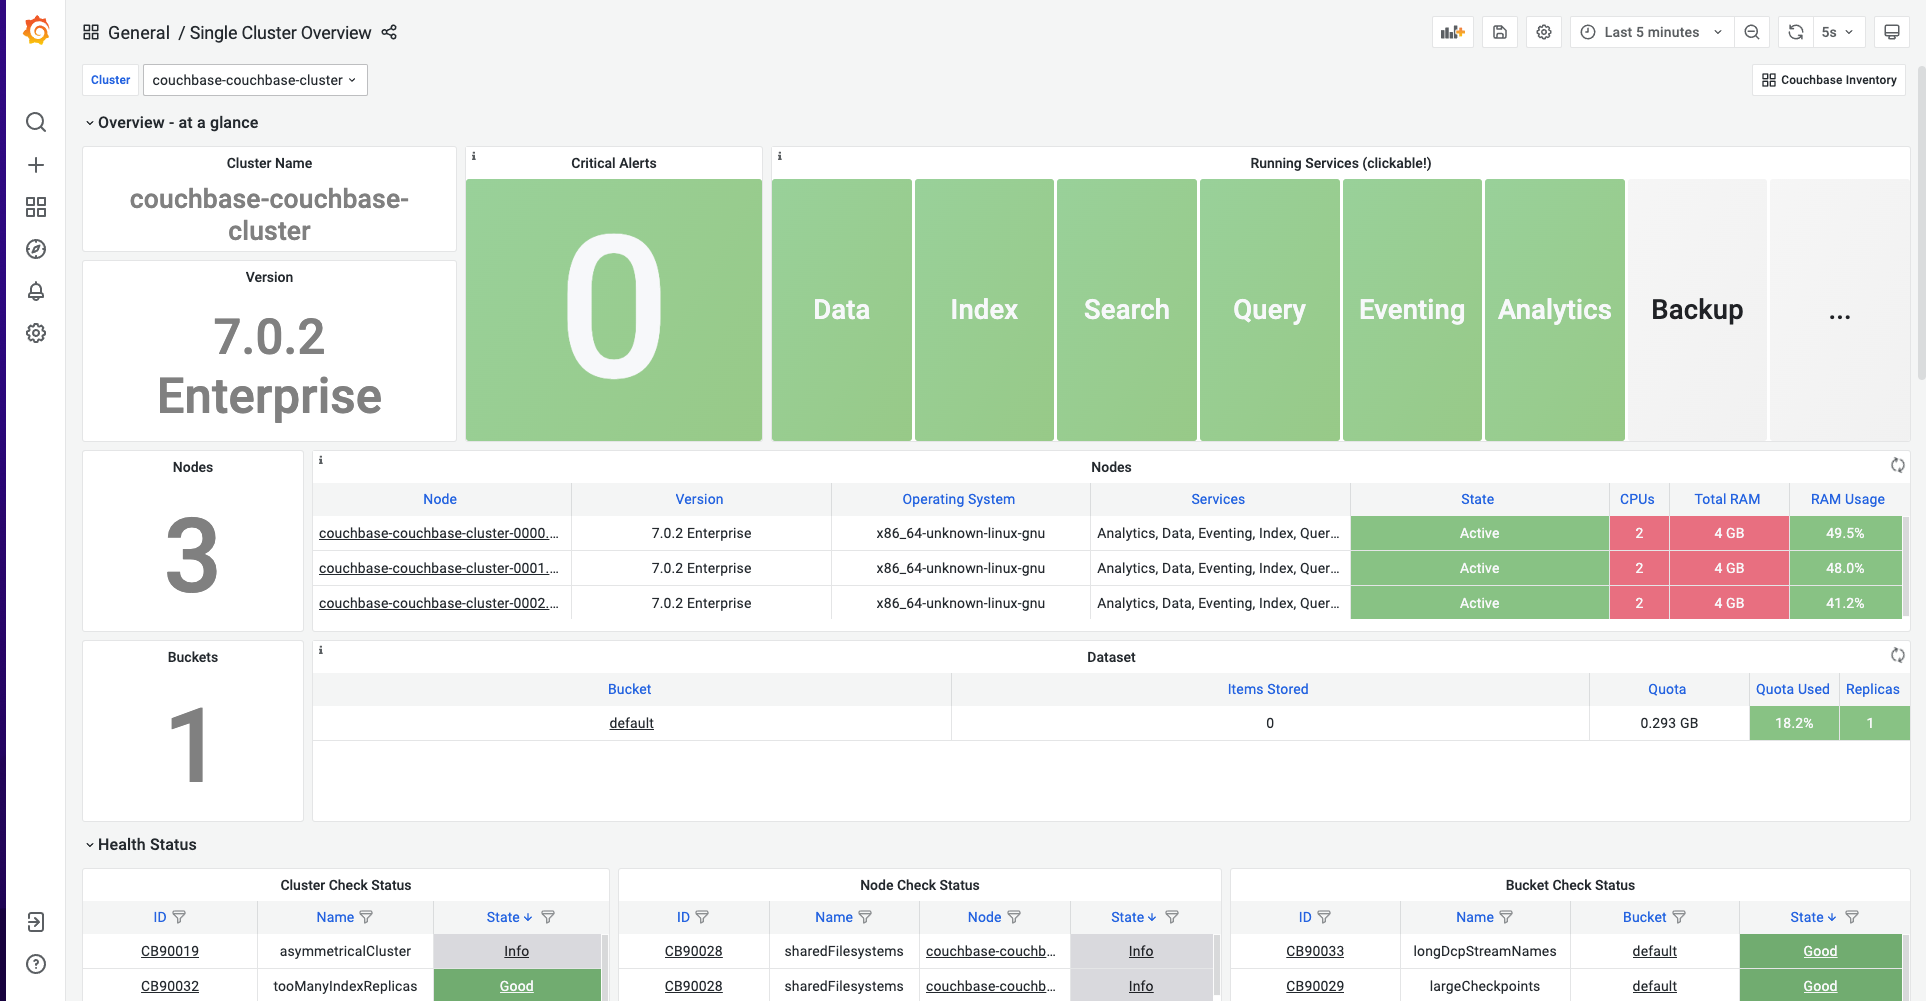
Couchbase Cluster Overview Metrics
Couchbase cluster overview metrics dashboard can be accessible on Grafana with name as: single-cluster-overview.
This dashboard displays a number of items including Couchbase nodes, buckets available, version information, health check warnings, and which services are running.
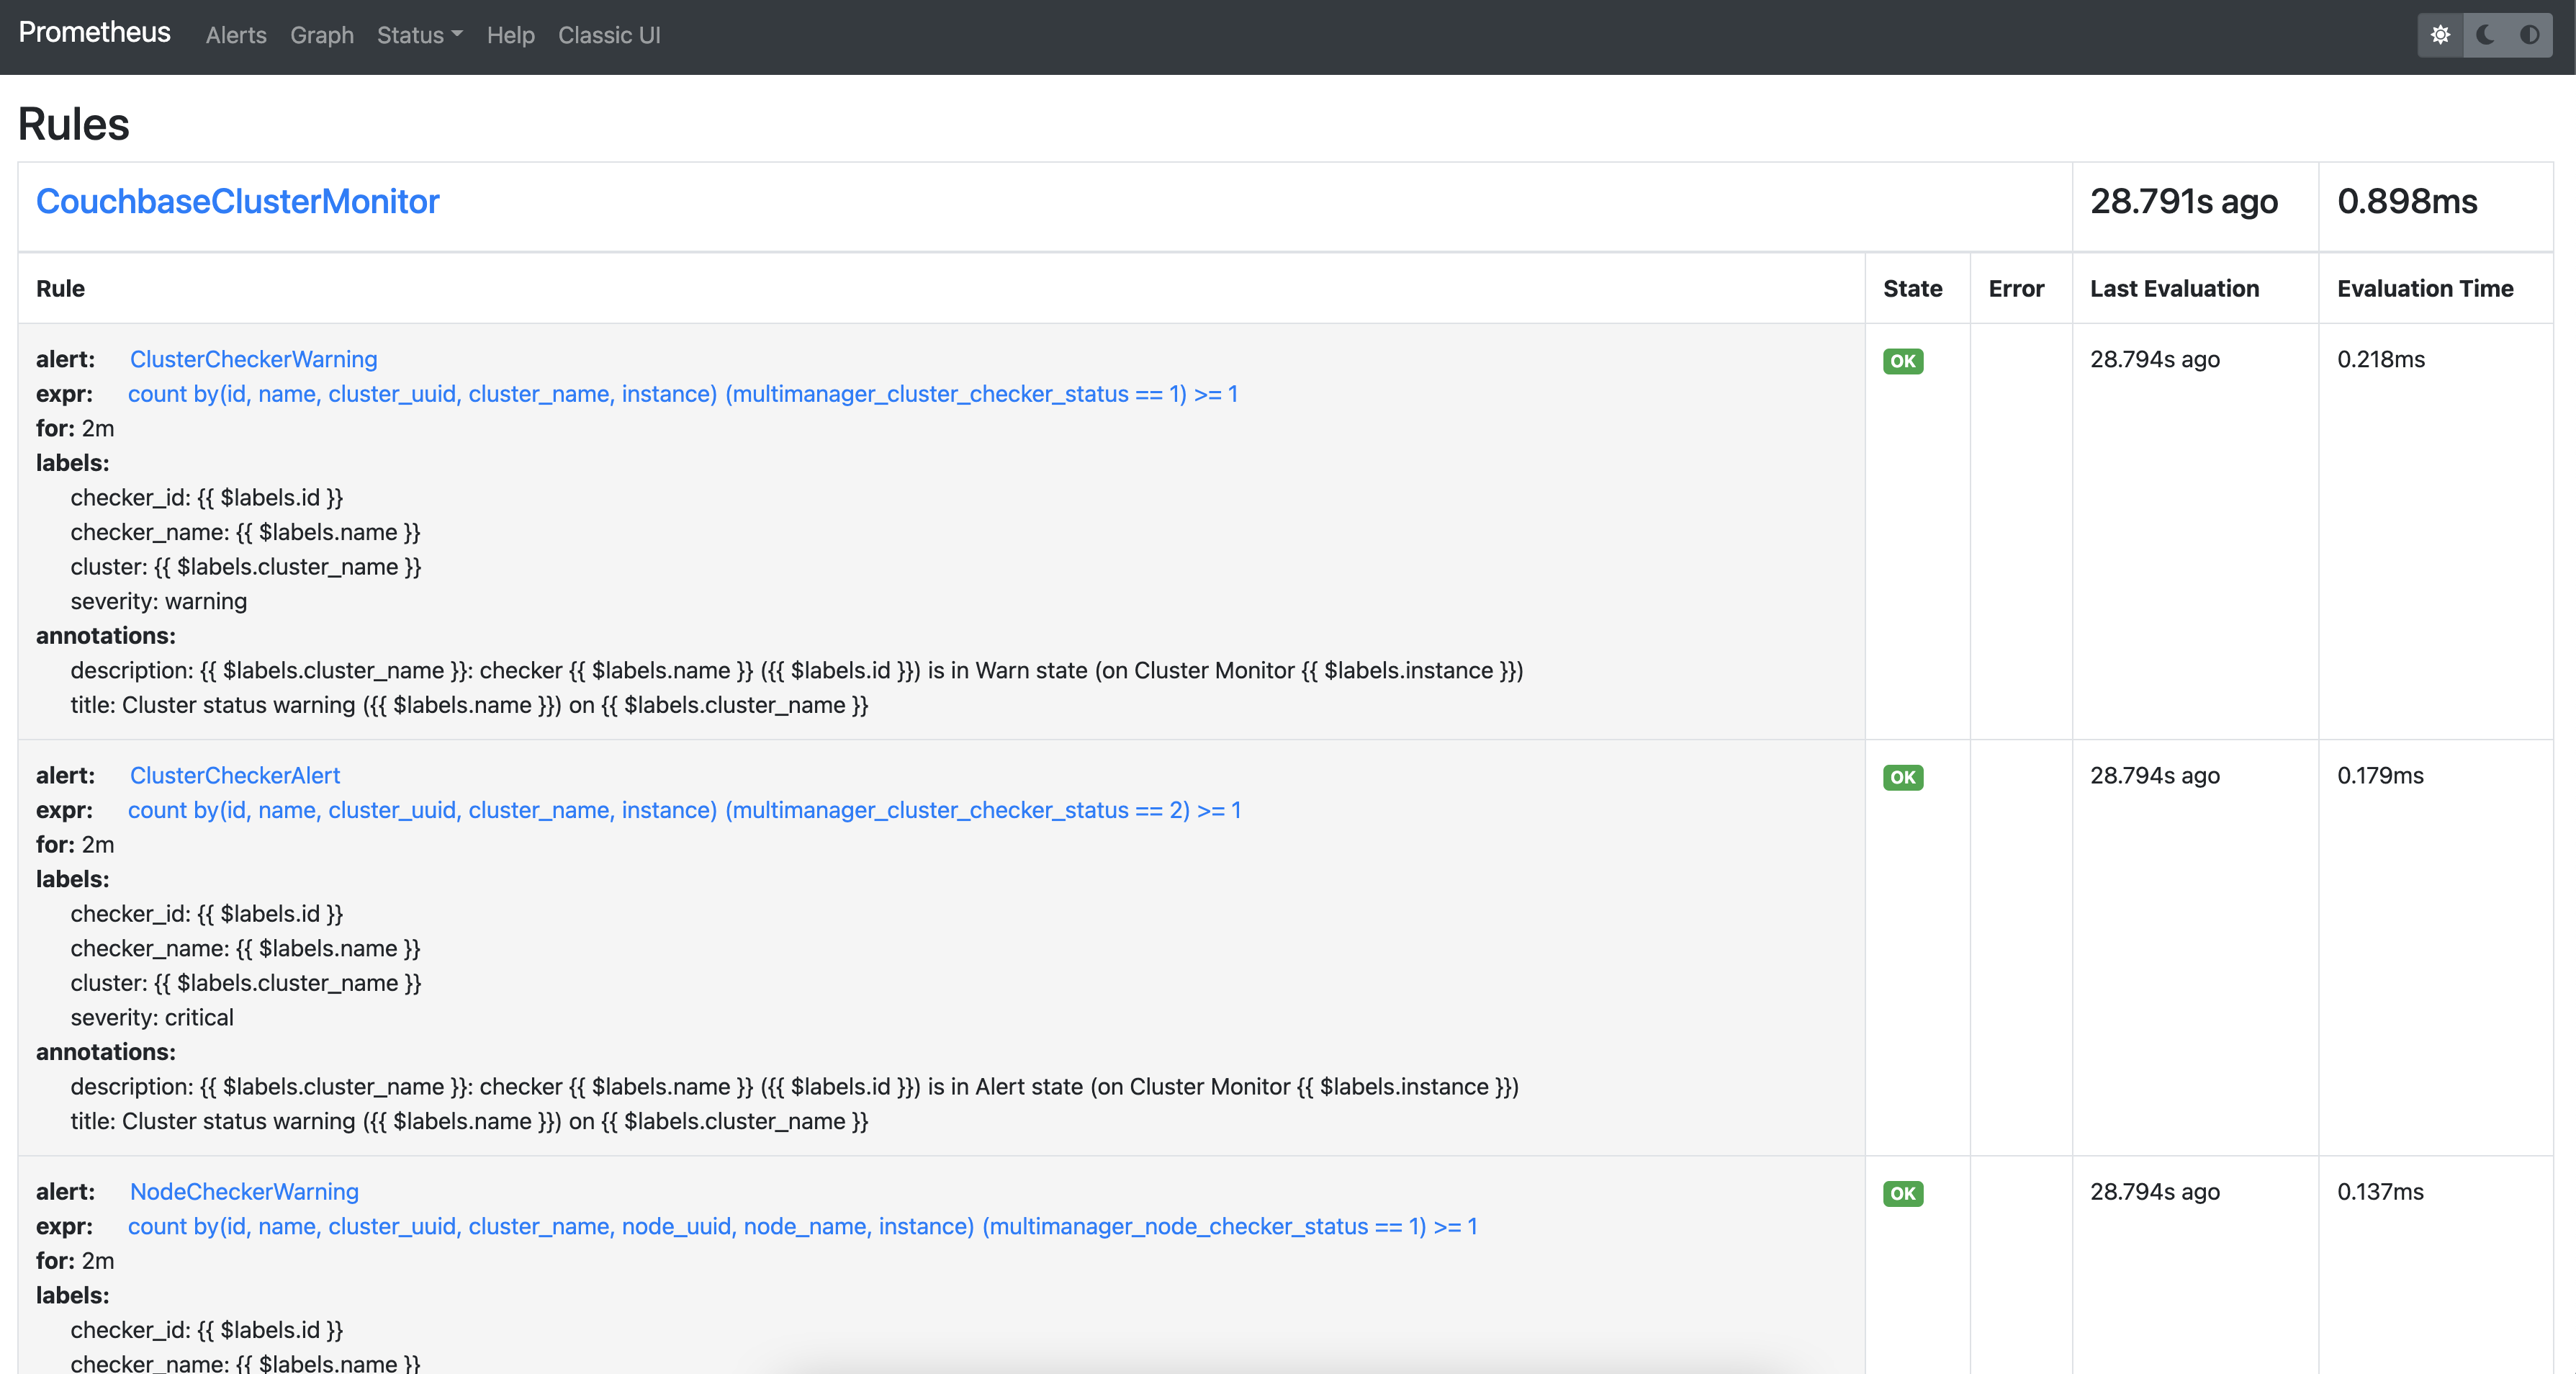
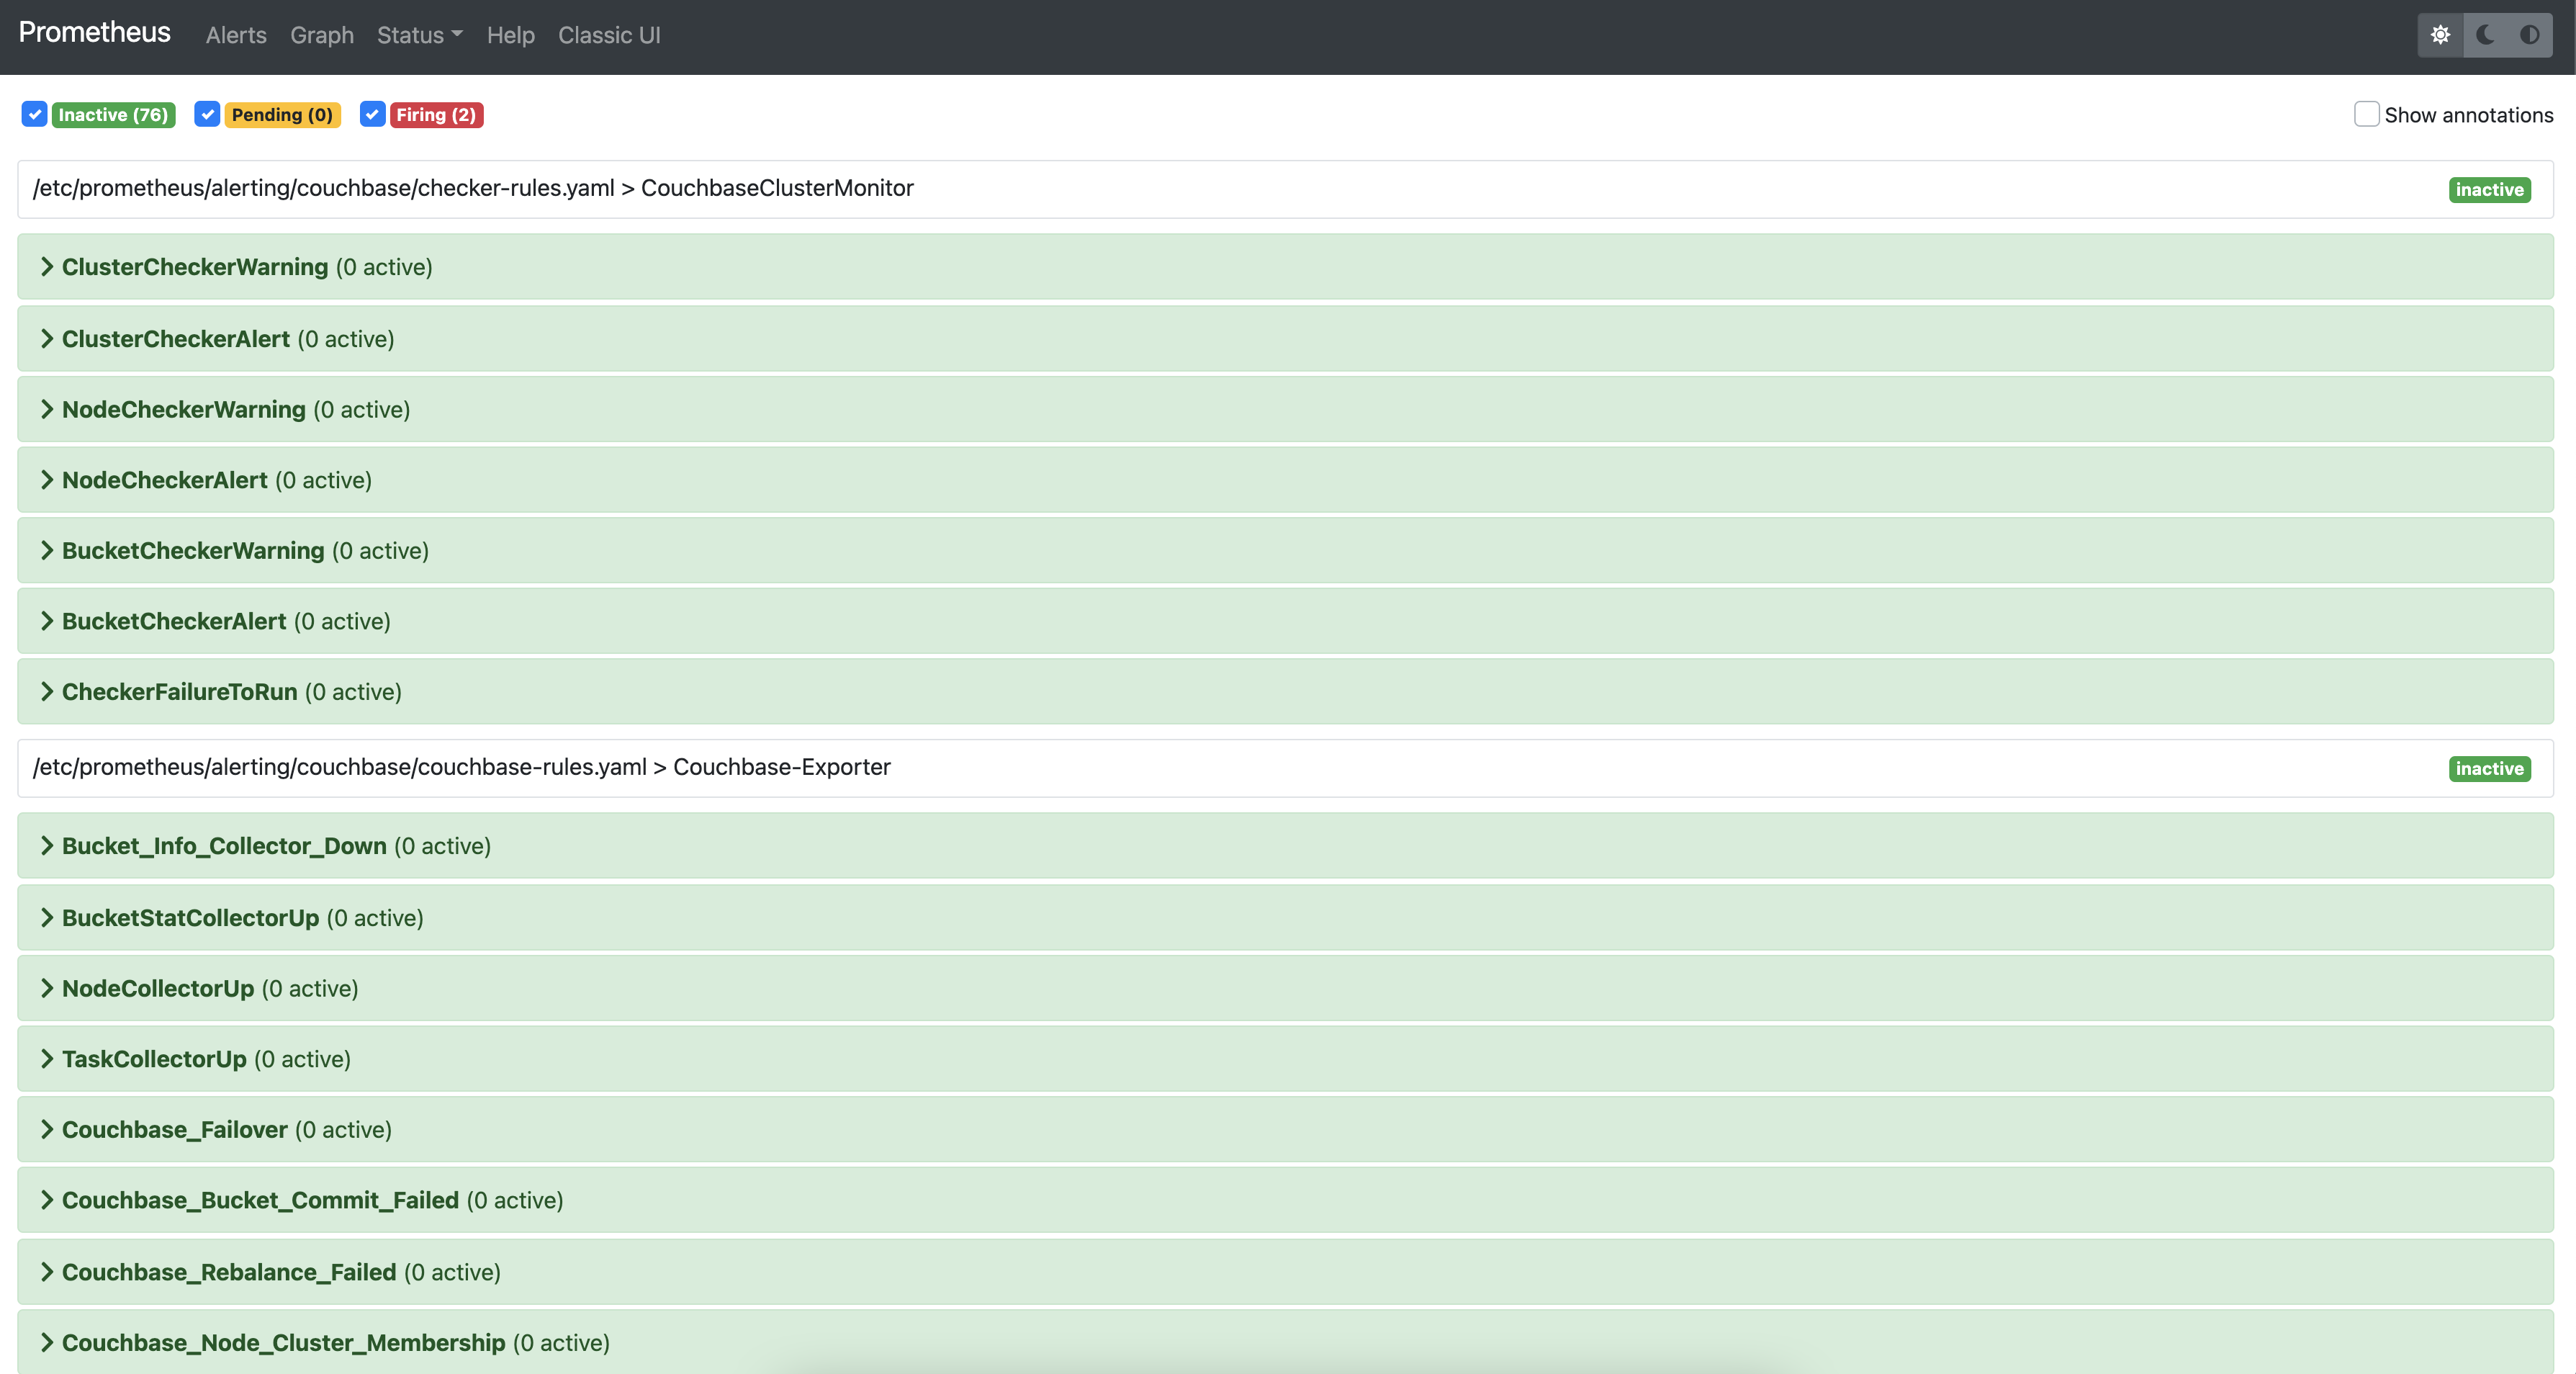
Alerts
CMOS comes with pre-installed alert rules to monitor the Couchbase cluster. Navigate to Alertmanager, prometheus UI to check the alert rules and alerts. For more information check the prometheus and alerting configuration section.
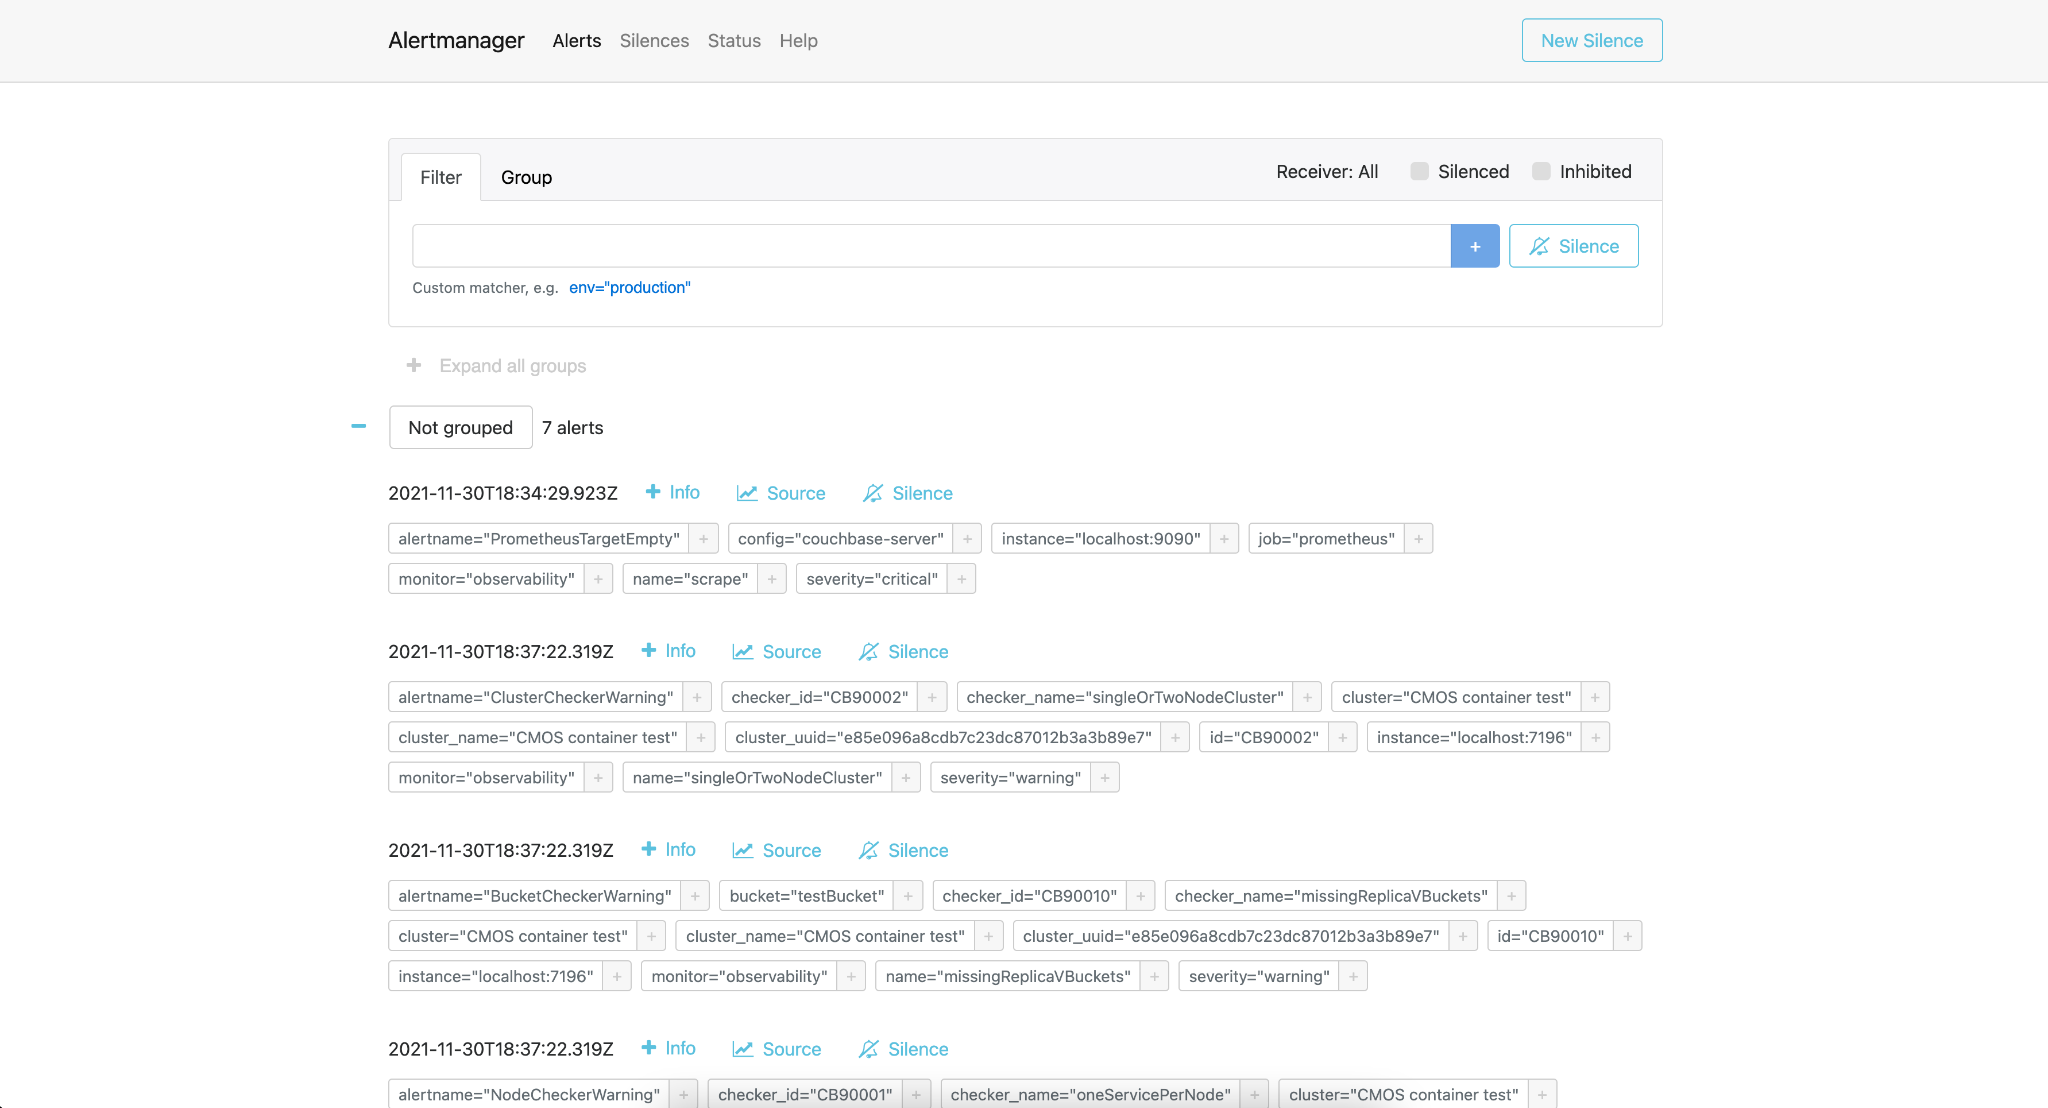
Alertmanager
Alertmanager is shipped and enabled by default in the CMOS, which is accessible via “Alert Manager” options. You can view all the generated alerts in this dashboard.
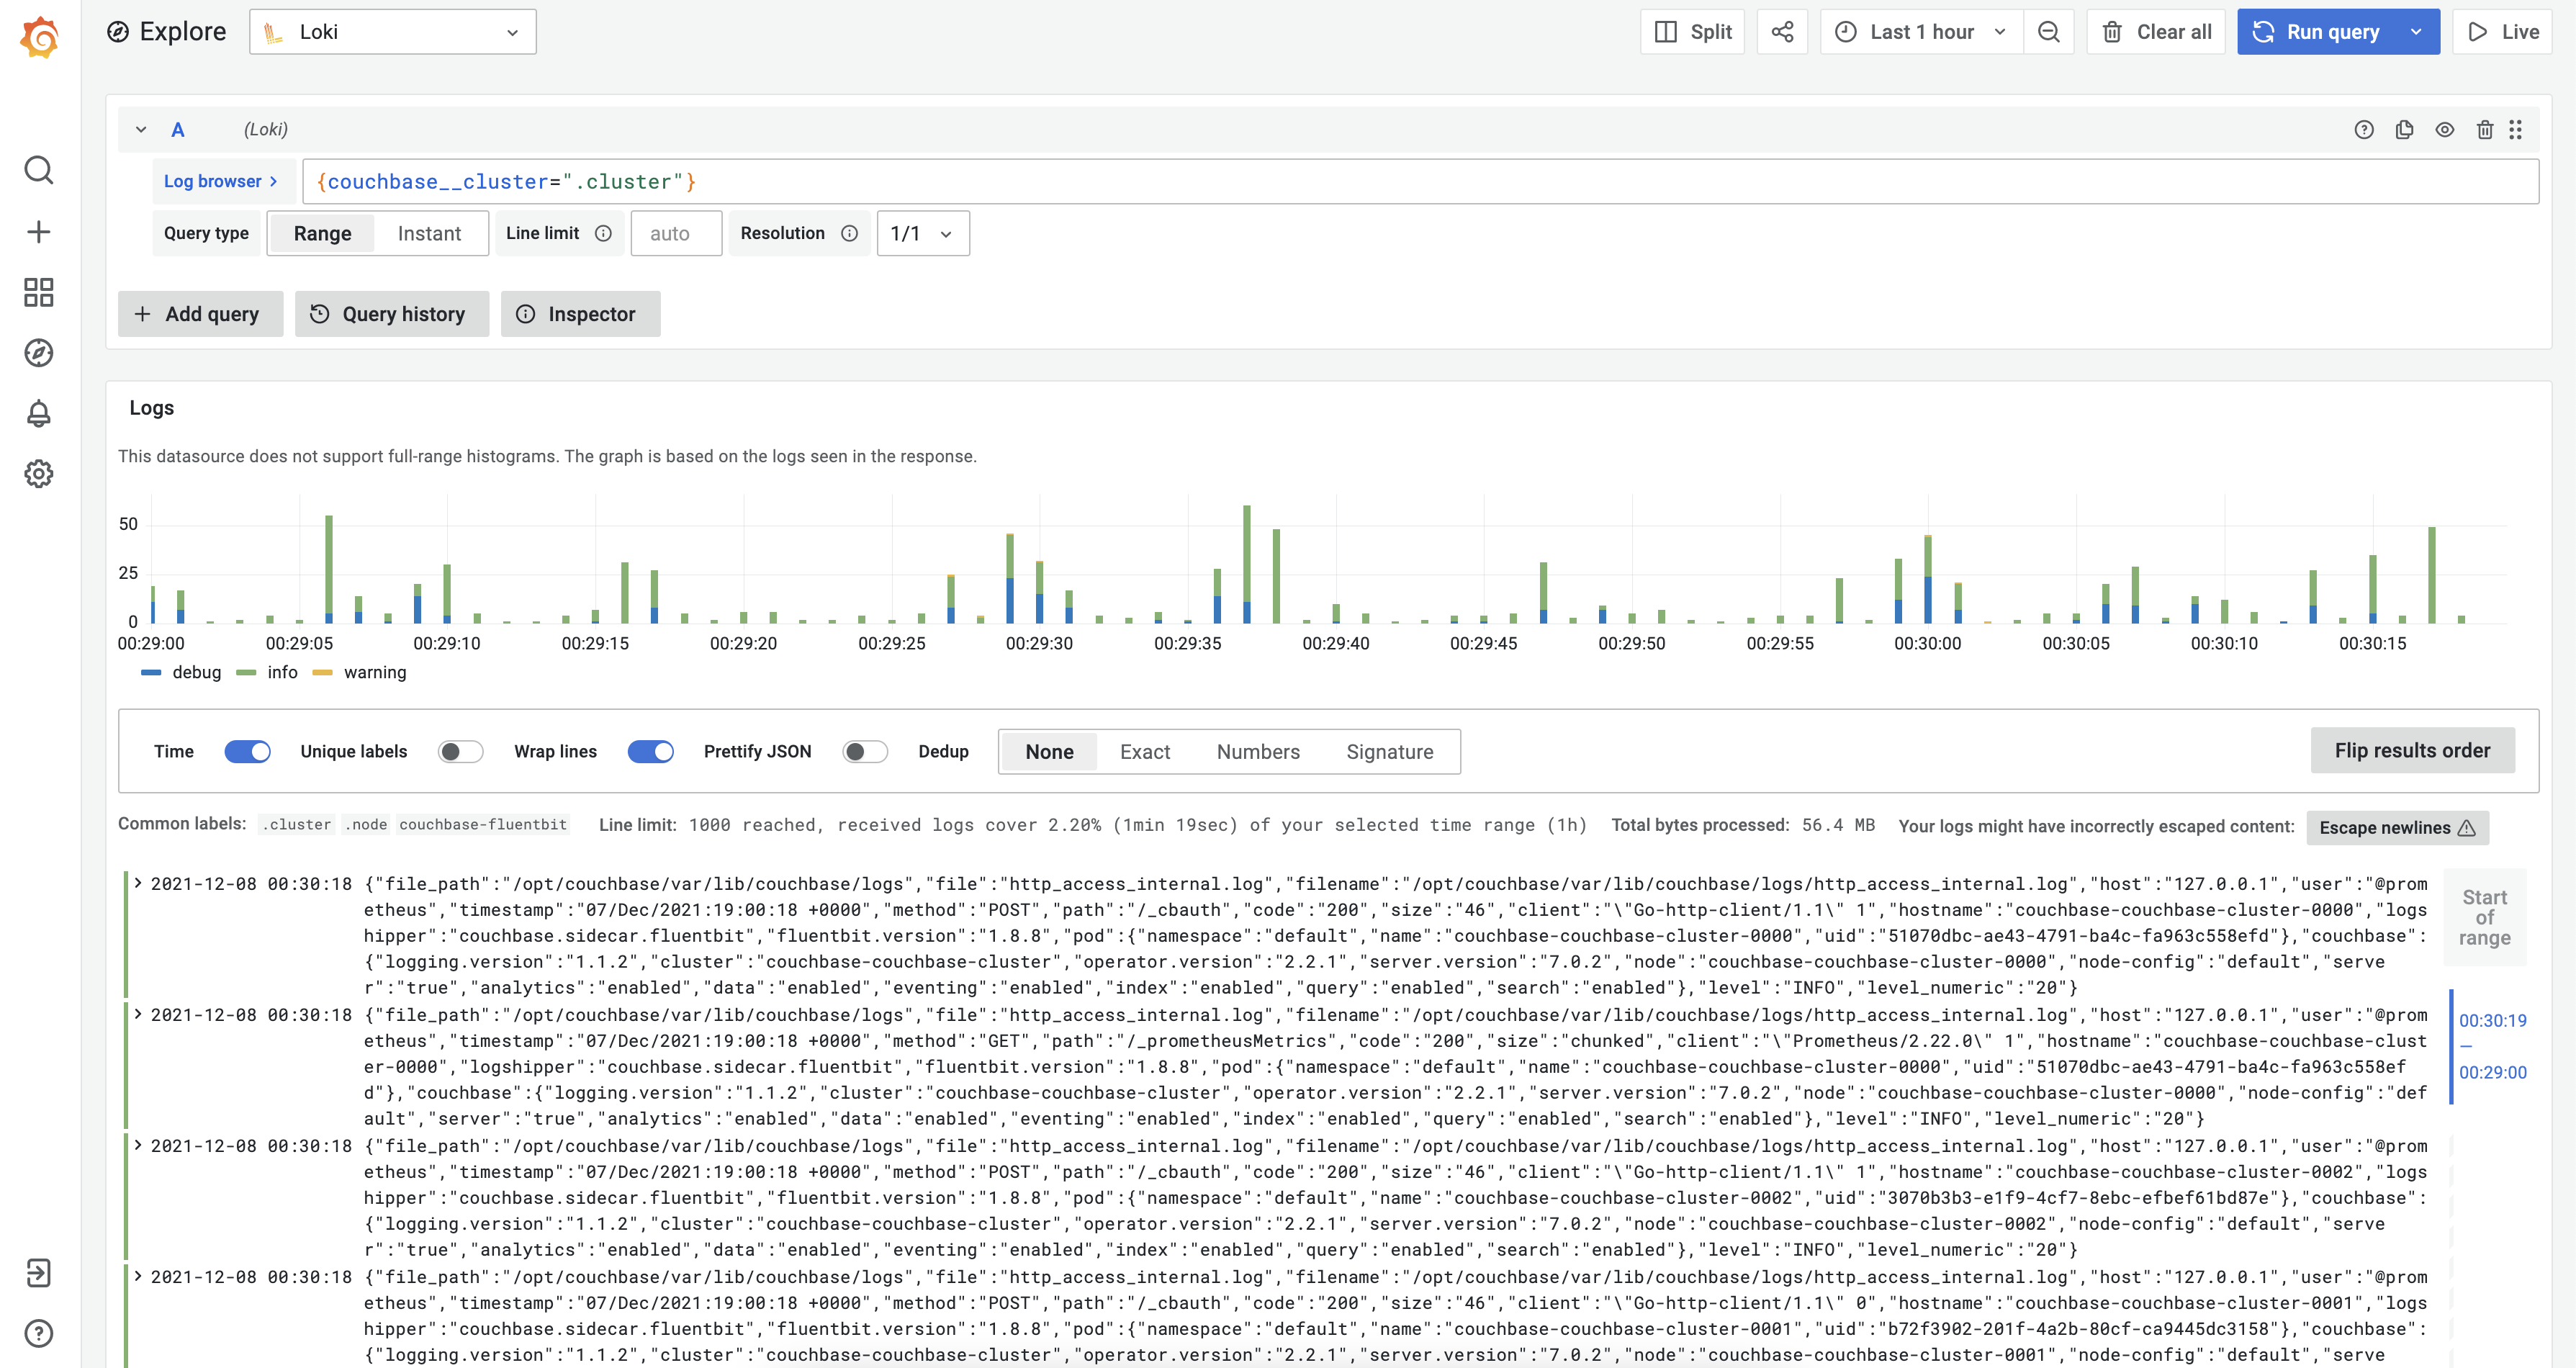
Loki
Loki, which is shipped with Grafana, allows access to logs of various components. You can configure it via Configuration > Data sources > Loki > Explore
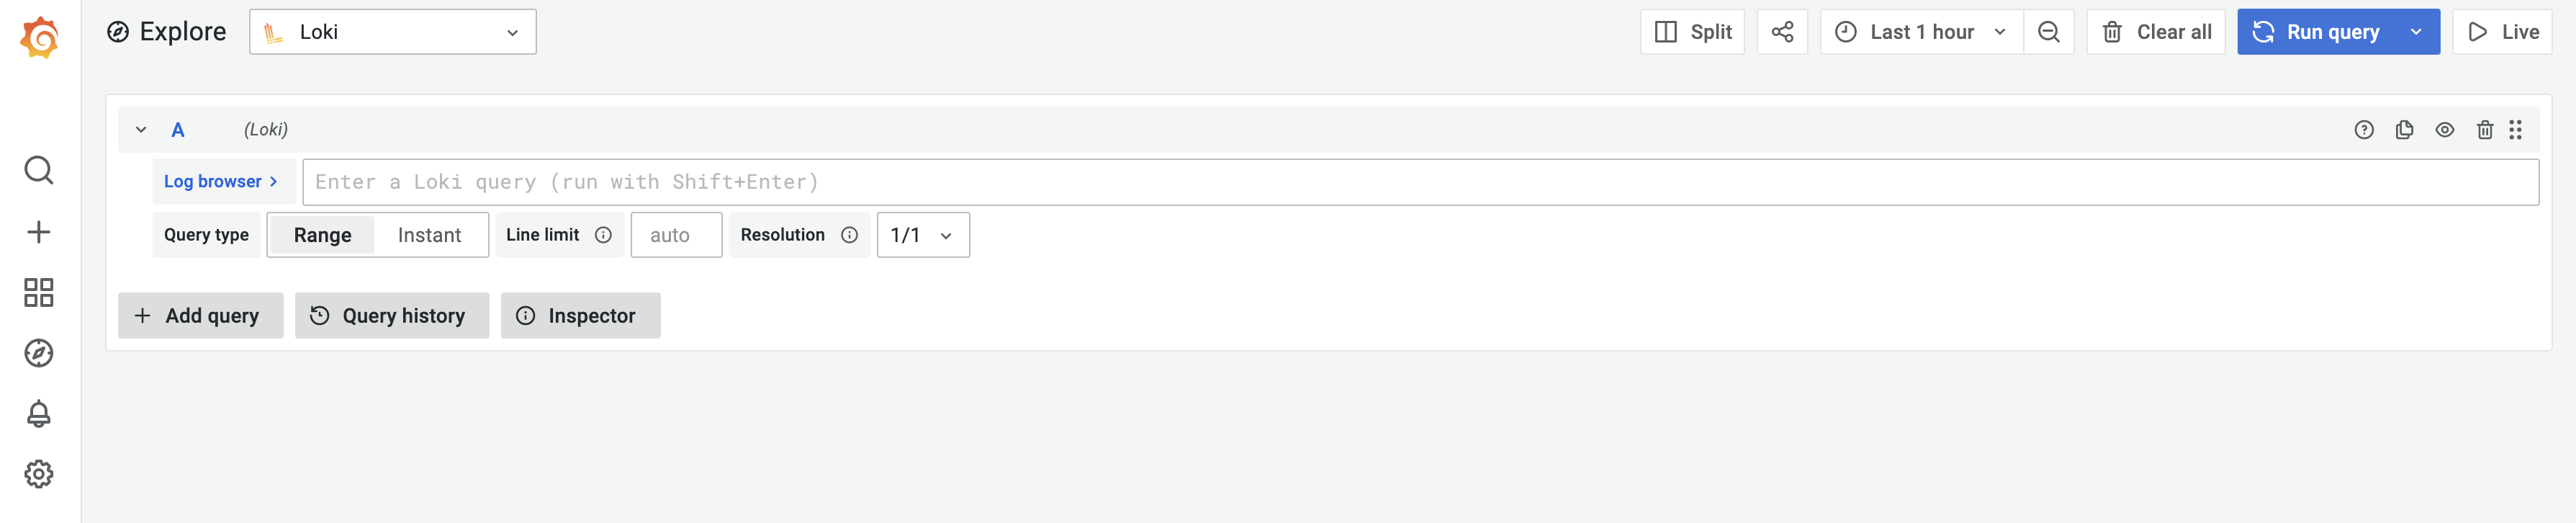
From the Log browser, you can enter a custom Loki query or select appropriate labels to see the logs.
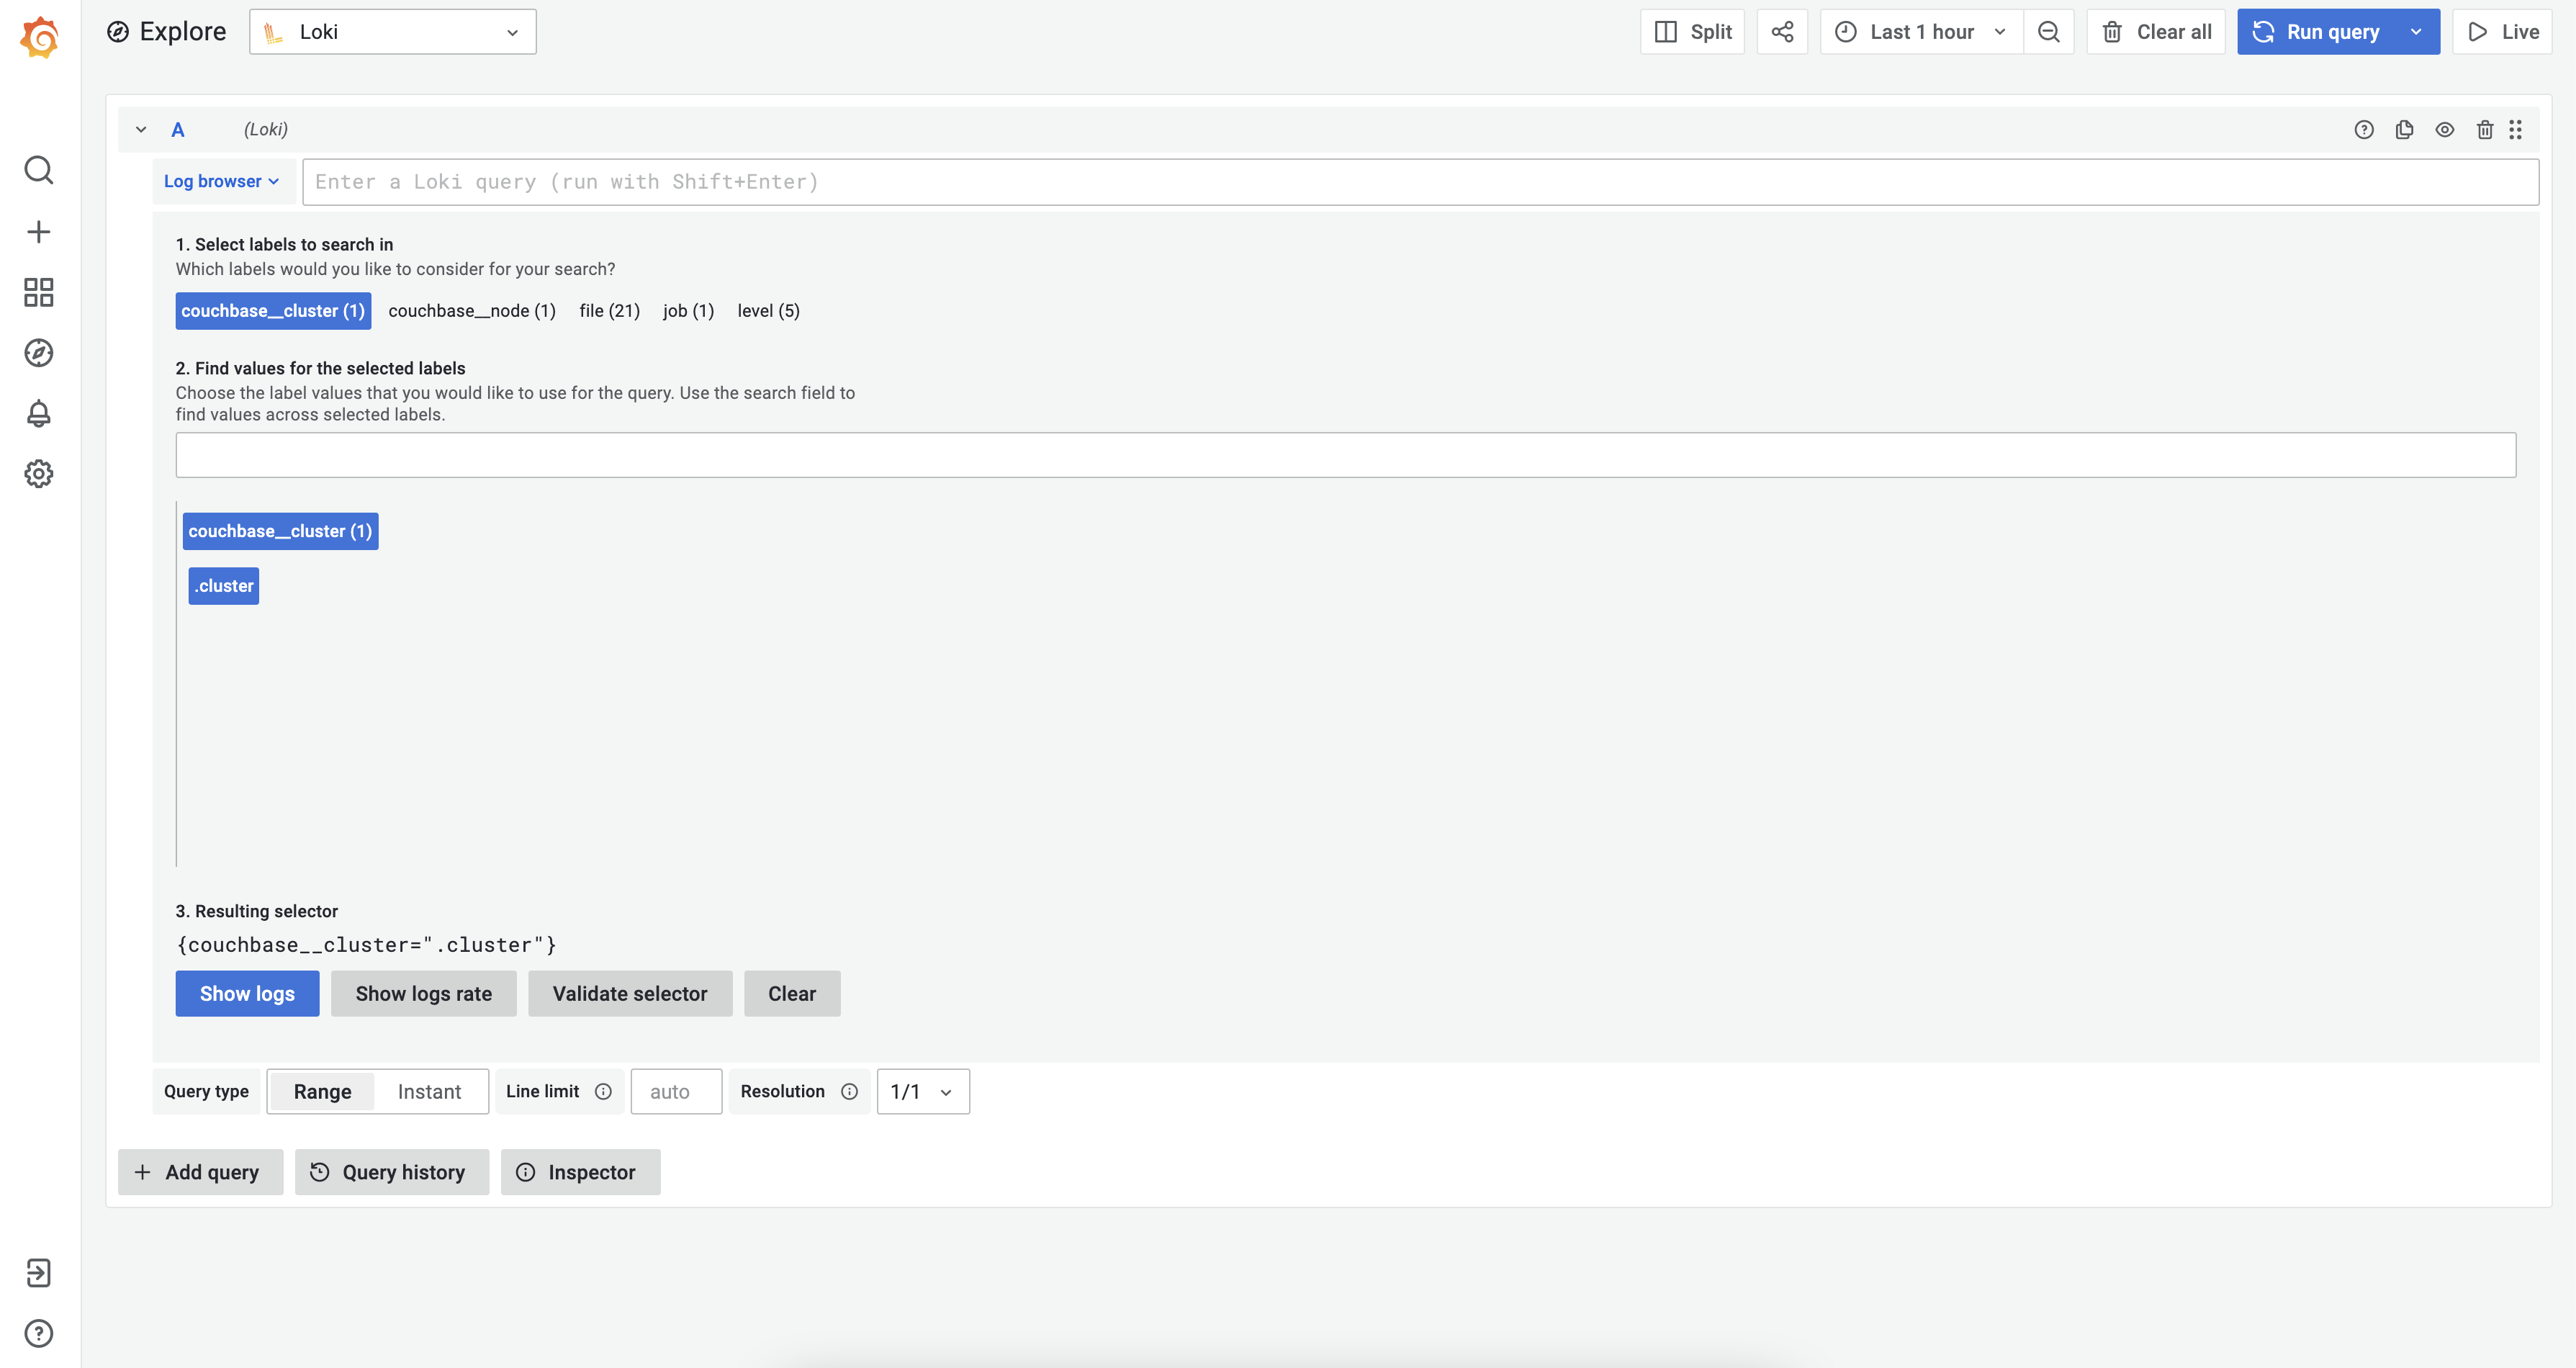
After that select the “Show logs” to view logs. You can also build custom Grafana dashboards based on your needs.