Monitor through the UI
- Capella App Services
App Services and Endpoints can be monitored through the Capella UI.
Monitoring the App Service through the Capella UI
Metrics data for an App Service can be accessed through its configuration screen:
-
In the navigation breadcrumbs in the Capella UI, do 1 of the following:
-
Click your organization name or expand and select the organization where you want to work with App Services.
-
Click your current project name or search for the project where you want to work with App Services.
-
-
Go to App Services.
-
Select your App Service from the list.
-
Go to App Endpoint.
-
Click Create App Endpoint.
-
Click the Monitoring tab to access the metrics screen.
You can select the metrics you wish to monitor from the Services list.
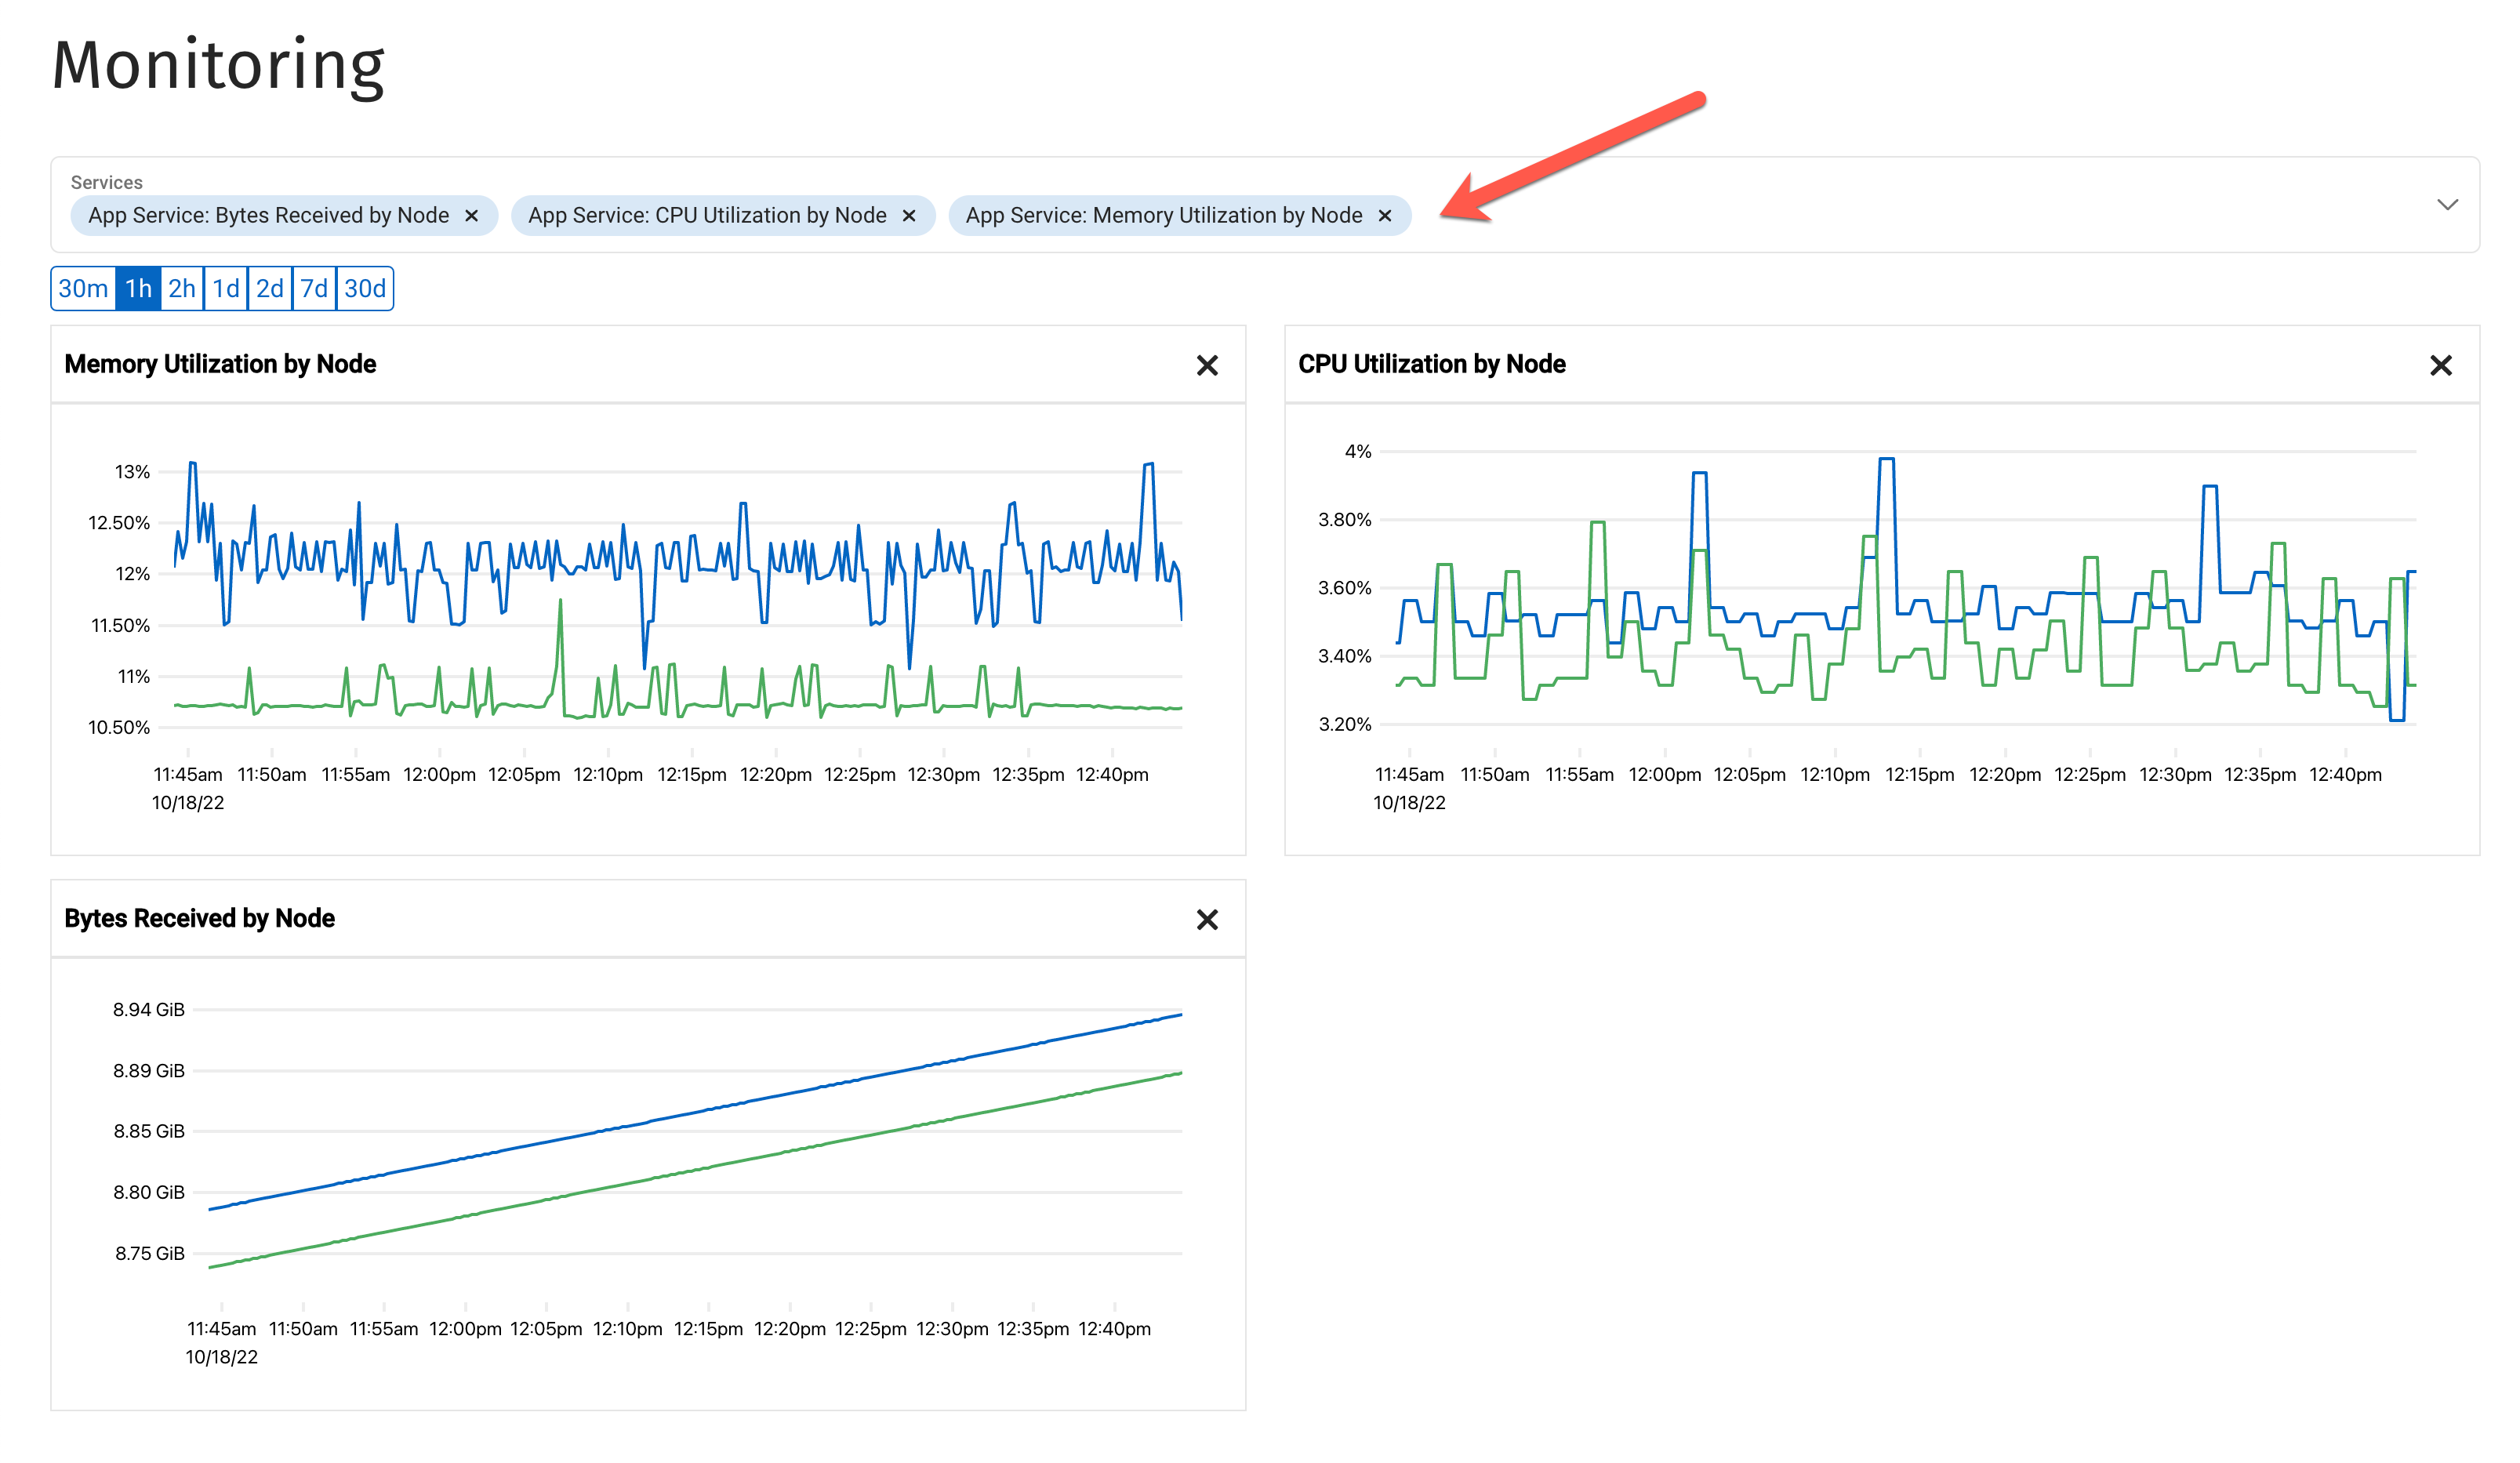
You can click on any of the time interval settings: (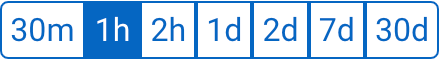 ) to set the time-span that the graphs will cover.
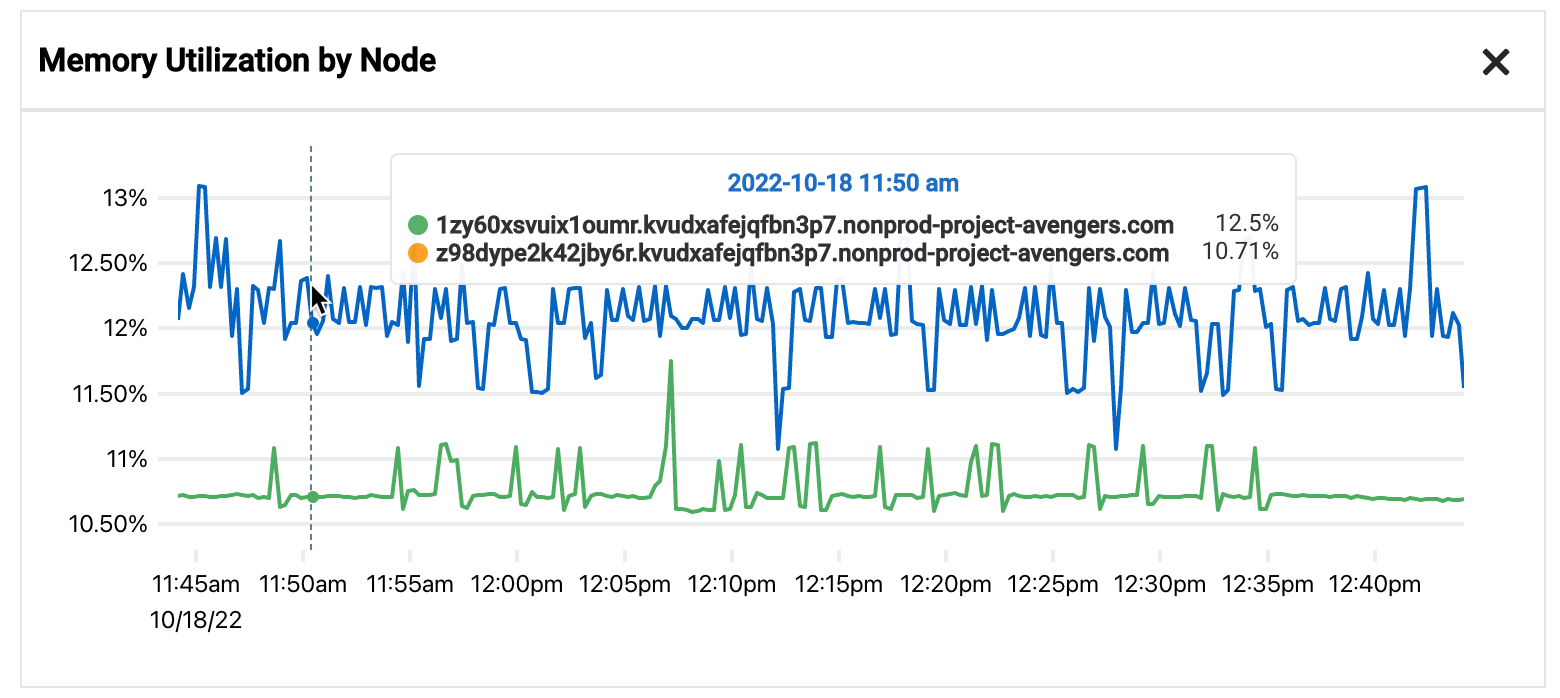
You can examine the underlying data for any point on a graph by pointing to it.
Monitoring an App Endpoint through the Capella UI
Metrics data for an App Endpoint can be accessed through the App Endpoint’s configuration screen:
-
From the App Services screen, select an App Service, and click the App Endpoints tab.
In the App Endpoints page, select an App Service Endpoint.
-
Click the Monitoring tab.
You can select the metrics you wish to monitor from the Services list.
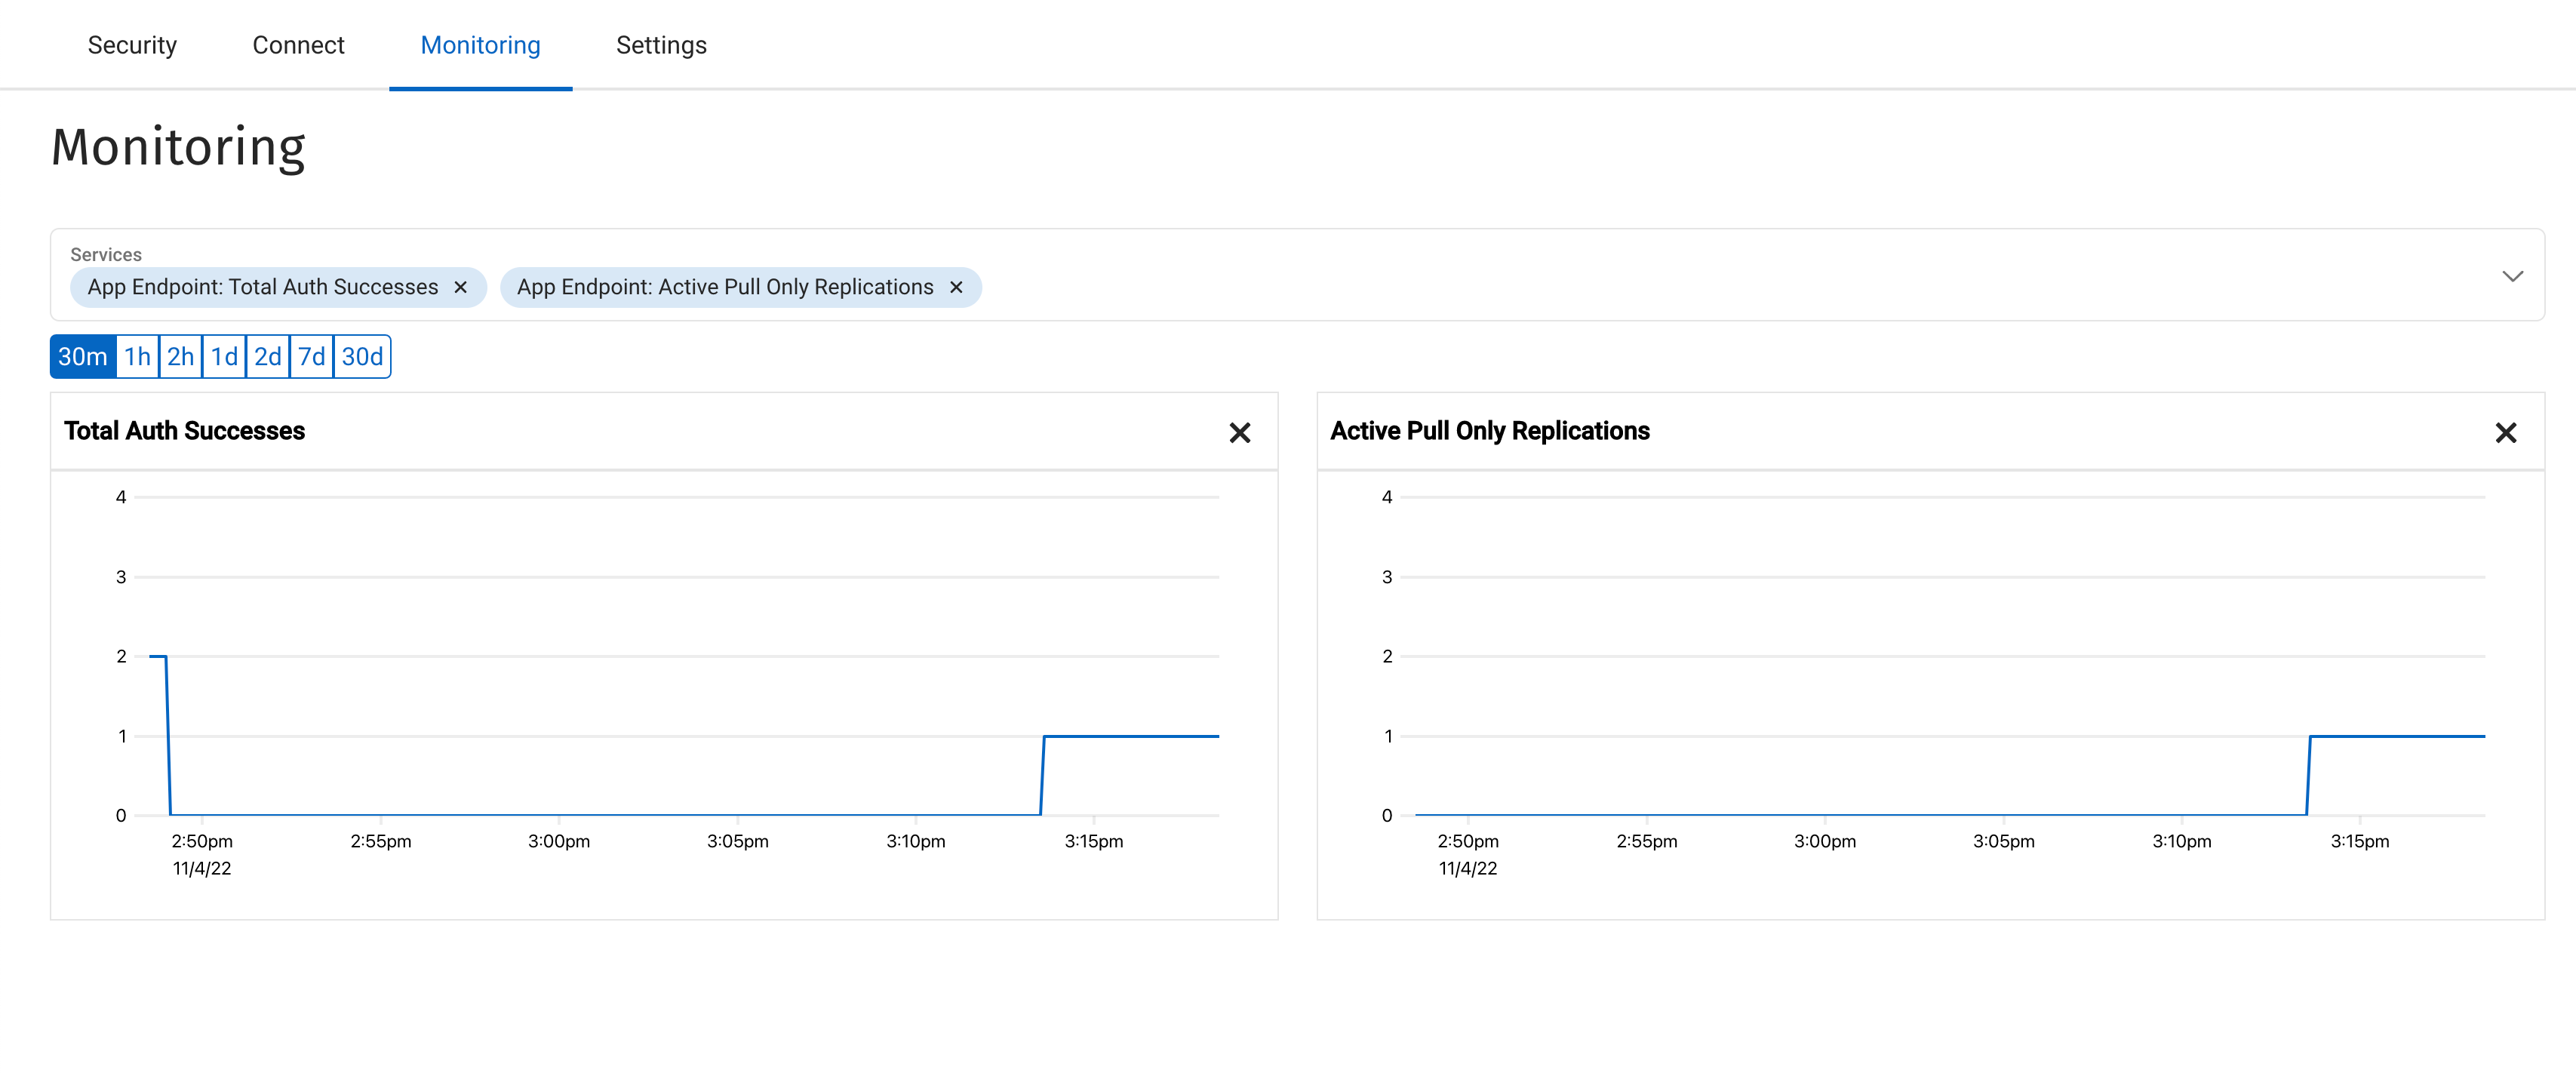
You can click on any of the time interval settings: (
) to set the time-span that the graphs will cover.You can examine the underlying data for any point on a graph by moving the mouse pointer over it.