Analytics Monitor
- Capella Operational
The Monitor flyout in the Analytics Workbench enables you to monitor Analytics queries and metrics.
You can monitor running and completed Analytics queries, and the status of the Analytics service, using the Monitor flyout in the Analytics Workbench.
Access the Monitor Flyout
To access the Monitor flyout, click the Monitor button in the Analytics Workbench. The Monitor flyout is displayed.
List Analytics Queries
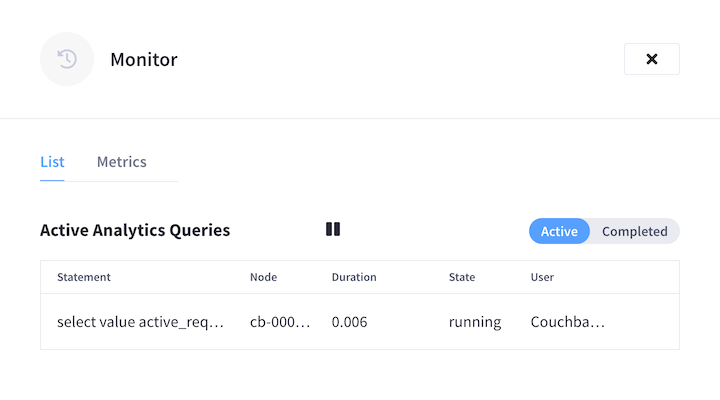
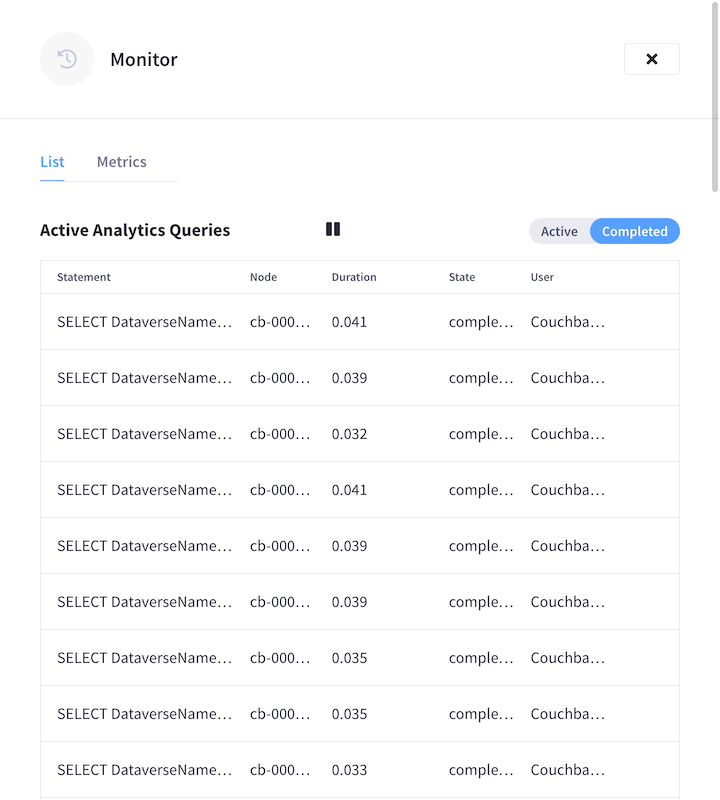
To list Analytics queries, click the List tab at the top of the Monitor flyout. A list of Analytics queries is displayed.
To see the active Analytics queries, click Active at the top of the list. The list displays active Analytics queries.

To see the completed Analytics queries, click Completed at the top of the list. The list displays completed Analytics queries.

The following information is displayed for each active or completed query.
| Option | Description |
|---|---|
Statement |
The SQL++ for Analytics query statement. |
Node |
The node which handled the request. |
Duration |
The time taken to run the request. |
State |
The state of the request: |
User |
The user who made the request. |
To pause monitoring the active or completed queries, click the pause ❚ ❚ button at the top of the list.
To continue monitoring the active or completed queries, click the play ▶ button at the top of the list.
Monitor Analytics Metrics
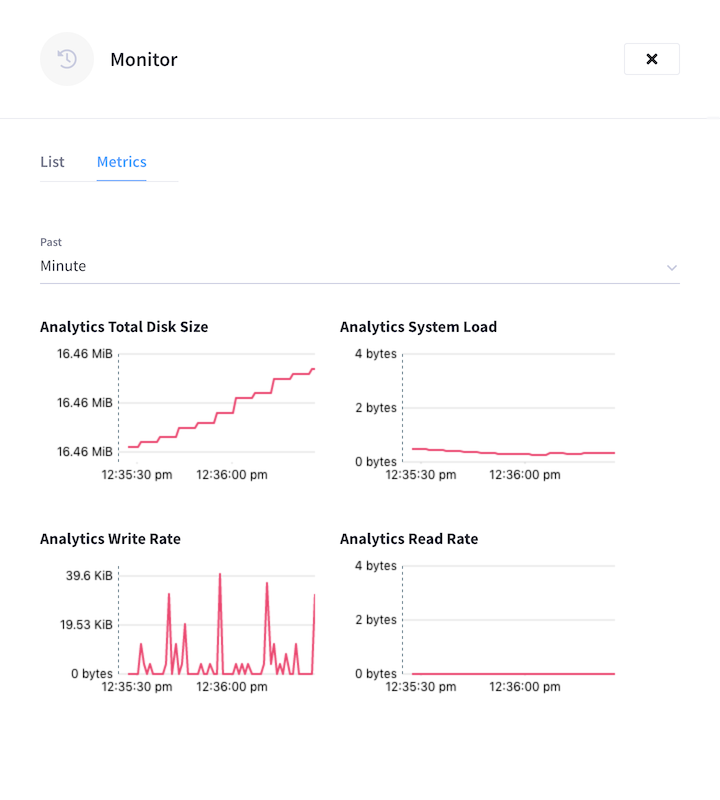
To monitor Analytics metrics, click the Metrics tab at the top of the Monitor flyout. A grid of charts is displayed.

The charts display the following information.
| Chart | Description |
|---|---|
Analytics Total Disk Size |
The total disk size used by the Analytics Service. |
Analytics System Load |
System load for Analytics Service. |
Analytics Write Rate |
The rate at which disk bytes are written for the Analytics Service. |
Analytics Read Rate |
The rate at which disk bytes are read for the Analytics Service. |
To change the timespan covered by the charts, open the Past drop-down list and select a duration: Minute, Hour, Day, Week, or Month.
To see the value at of any chart at a specific time, hover the mouse pointer over a chart at the time you want to inspect. A pop-up tooltip shows the monitored value at the indicated time.