You can run queries using the Analytics Workbench, the command line query tool cbq, or directly through the REST API.
You can also run Analytics queries using a software development kit (SDK), or via the ODBC or JDBC drivers.
For the examples, we assume that:
-
You’re running a Couchbase node with the Analytics service on localhost — the DNS name in the URL could be different in a Docker or a real cluster setup.
-
You authenticate as a user with the "Full Administrator" role with the user name
Administratorand the passwordpassword— of course you should use different credentials for your installation.
Using the Analytics Workbench
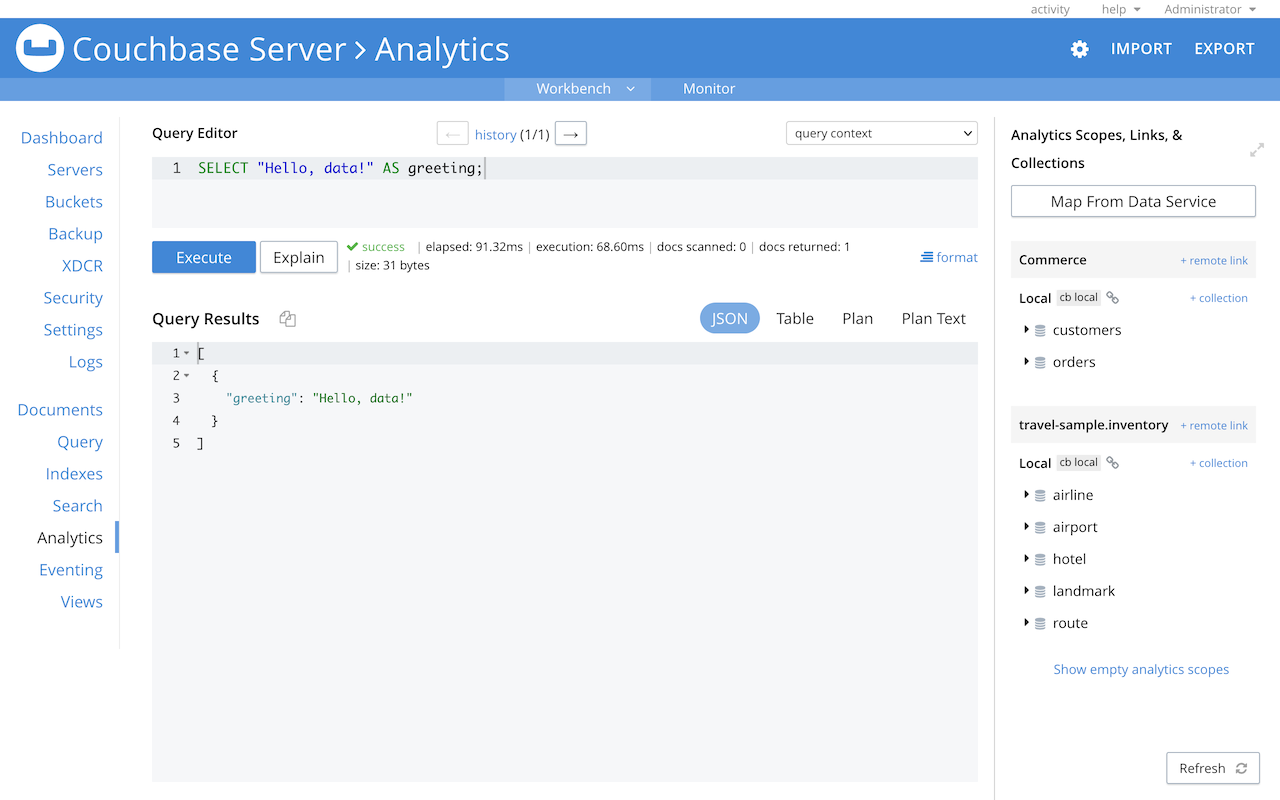
The Analytics Workbench — like the Query Workbench — provides a graphical user interface for query development.
To access the Analytics Workbench open a browser and go to http://localhost:8091, log in, and select the Analytics menu in the Couchbase Web Console.
Enter the following test query and click Execute:
SELECT "Hello, data!" AS greeting;
The result of this query is an array that contains an single object containing a field "greeting" with the value "Hello, data!":
The Analytics Workbench supports multi-line statements, just like the Query Workbench.
You can press the Execute button to execute a statement at any time.
You can also execute a statement by typing a semicolon ; at the end of the
statement, and then pressing Enter or Return.
|
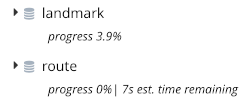
The insights sidebar to the right of the Analytics Workbench shows the Analytics scopes, the links within each scope, and the Analytics collections on each link. When data ingestion is in progress, an indicator below each collection shows the percentage of mutations that remain to be synchronized to that collection. If the indicator is not displayed, then the collection is up-to-date.
You can click Hide empty analytics scopes at the bottom of the insights sidebar to hide any scopes or links that do not contain collections. (The Default collection heading is always shown.) Click Show empty analytics scopes to show scopes and links that do not contain collections.
The information in the insights sidebar is updated regularly, but it may take a short time to reflect recent changes. To force the insights sidebar to update, click Refresh.
You can also use the insights sidebar to manage the links and collections. Refer to Managing Links and Managing Collections.
The query context drop-down menu at the top right of the Query Editor enables you to specify the default Analytics scope for any query that you enter in the Analytics Workbench.
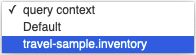
If you have set the query context, you don’t need to enter the Analytics scope name when you refer to a database entity in the Query Editor; you only need to enter the name of the Analytics collection. The collection is assumed to be within the scope specified by the query context. Of course, you can still explicitly enter the full scope and collection name of a database entity if required. For more details, refer to Resolving Database Entities.
Using the Command Line Query Tool
You can use the command line tool, cbq, to run queries.
cbq is the command line shell for executing queries against the Query service as well as the Analytics service in
Couchbase.
Run cbq with the following options to specify the user, password, host, and port for the Analytics service:
$ cbq -u Administrator -p password -e "http://localhost:8095"
Enter the query in cbq:
cbq> SELECT "Hello, data!" AS greeting;
{
    "requestID": "8c73209a-2b0e-427f-b80b-3a7b25819299",
    "signature": {
        "*": "*"
    },
    "results": [ {
        "greeting" : "Hello, data!"
    } ]
    ,
    "plans":{},
    "status": "success",
    "metrics": {
        "elapsedTime": "51.513364ms",
        "executionTime": "37.085081ms",
        "resultCount": 1,
        "resultSize": 34,
        "processedObjects": 0
    }
}
Here you can see that the result shown in the Analytics Workbench is embedded in an envelope that contains additional
information about the request like the requestID, the status, and some metrics.
Using the REST API
You can use the REST API to run Analytics queries. When the cluster is up, requests can be posted to Couchbase Analytics. The endpoint http://localhost:8095/analytics/service implements the same HTTP interface as the Couchbase Query service. For details, see Analytics REST API.
For example, you can run the query SELECT "Hello, data!" AS greeting through curl:
$ curl -u Administrator:password http://localhost:8095/analytics/service \
  -d 'statement=SELECT "Hello, data!" AS greeting'
The request returns:
{
    "requestID": "2a19f2fc-456f-485b-b814-714212c9ef1b",
    "signature": {
        "*": "*"
    },
    "results": [ { "greeting": "Hello, data!" }
]
    ,
    "plans":{},
    "status": "success",
    "metrics": {
        "elapsedTime": "42.73086ms",
        "executionTime": "30.836046ms",
        "resultCount": 1,
        "resultSize": 31,
        "processedObjects": 0
    }
}
again including the envelope that we’ve seen in the example above.
Using the SDKs, ODBC, or JDBC
You can also run Analytics queries using a software development kit (SDK). For details, refer to sdk:overview.adoc and select the required language.
For example, to get more information about running an Analytics query using the Java SDK, refer to Analytics using the Java SDK. A similar page is available for each SDK.
You can also run Analytics queries via the ODBC or JDBC drivers. For details, refer to Couchbase ODBC and JDBC Drivers.