Eventing Statistics, for each deployed Function, can be fetched from an Eventing node using the Web Console or using the REST API.
Via the Web Console’s Eventing page
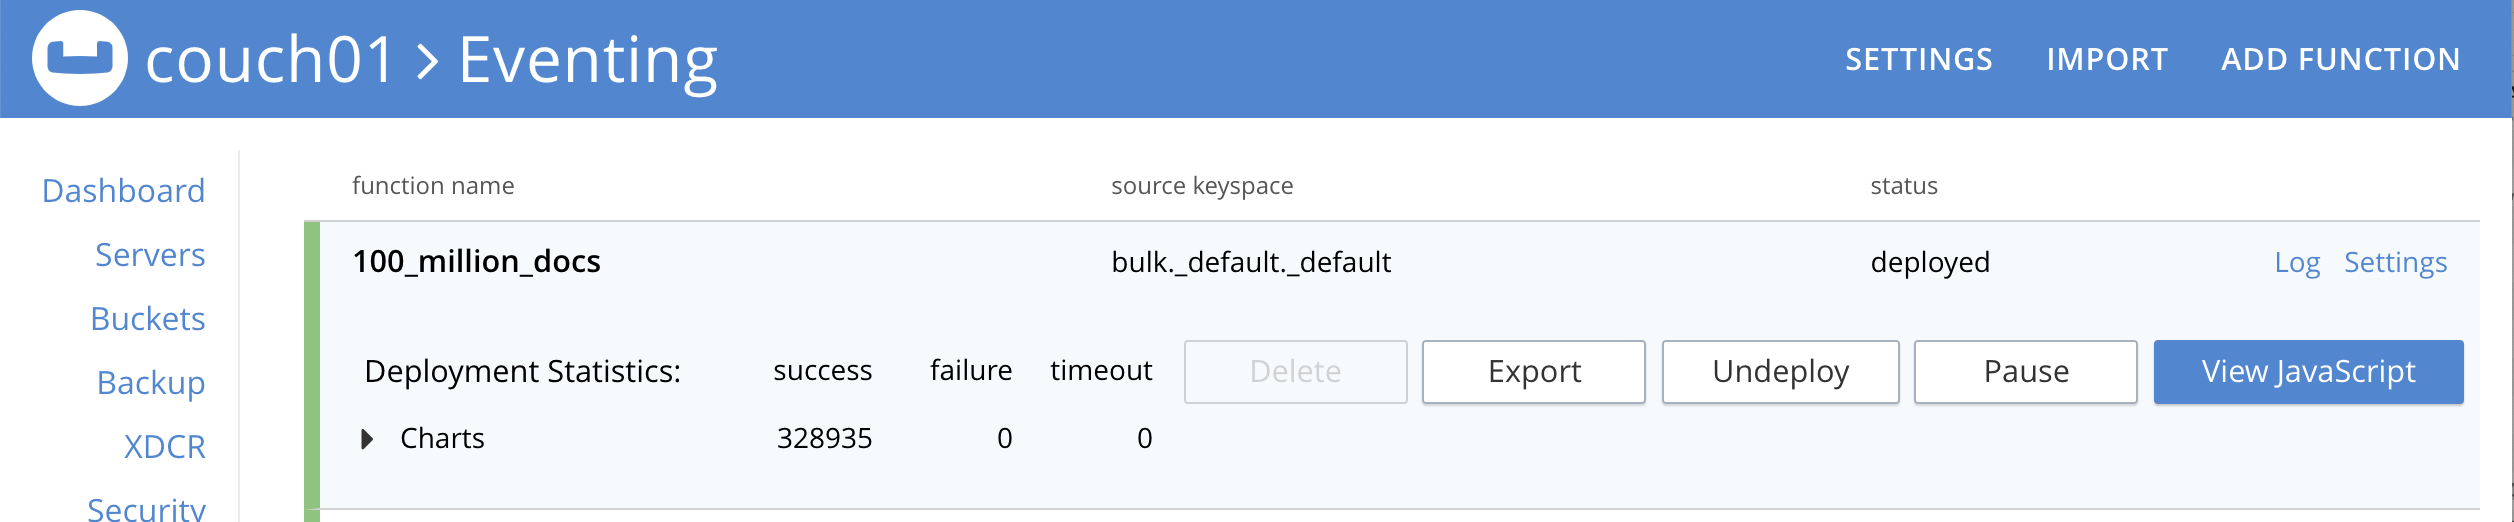
As of 7.0.0, Eventing Statistics can be displayed in the Eventing main UI page for each deployed Function by clicking on the Function name to expand the Function controls. These three key metrics or Deployment Statistics are updated every 10 seconds by default and displayed as numeric values:
-
success - displays the number of processed Functions and also Eventing timer callbacks.
-
failure - displays the number of failures while processing the Eventing Function code.
-
timeout - displays the number of Functions which have encountered a timeout condition.
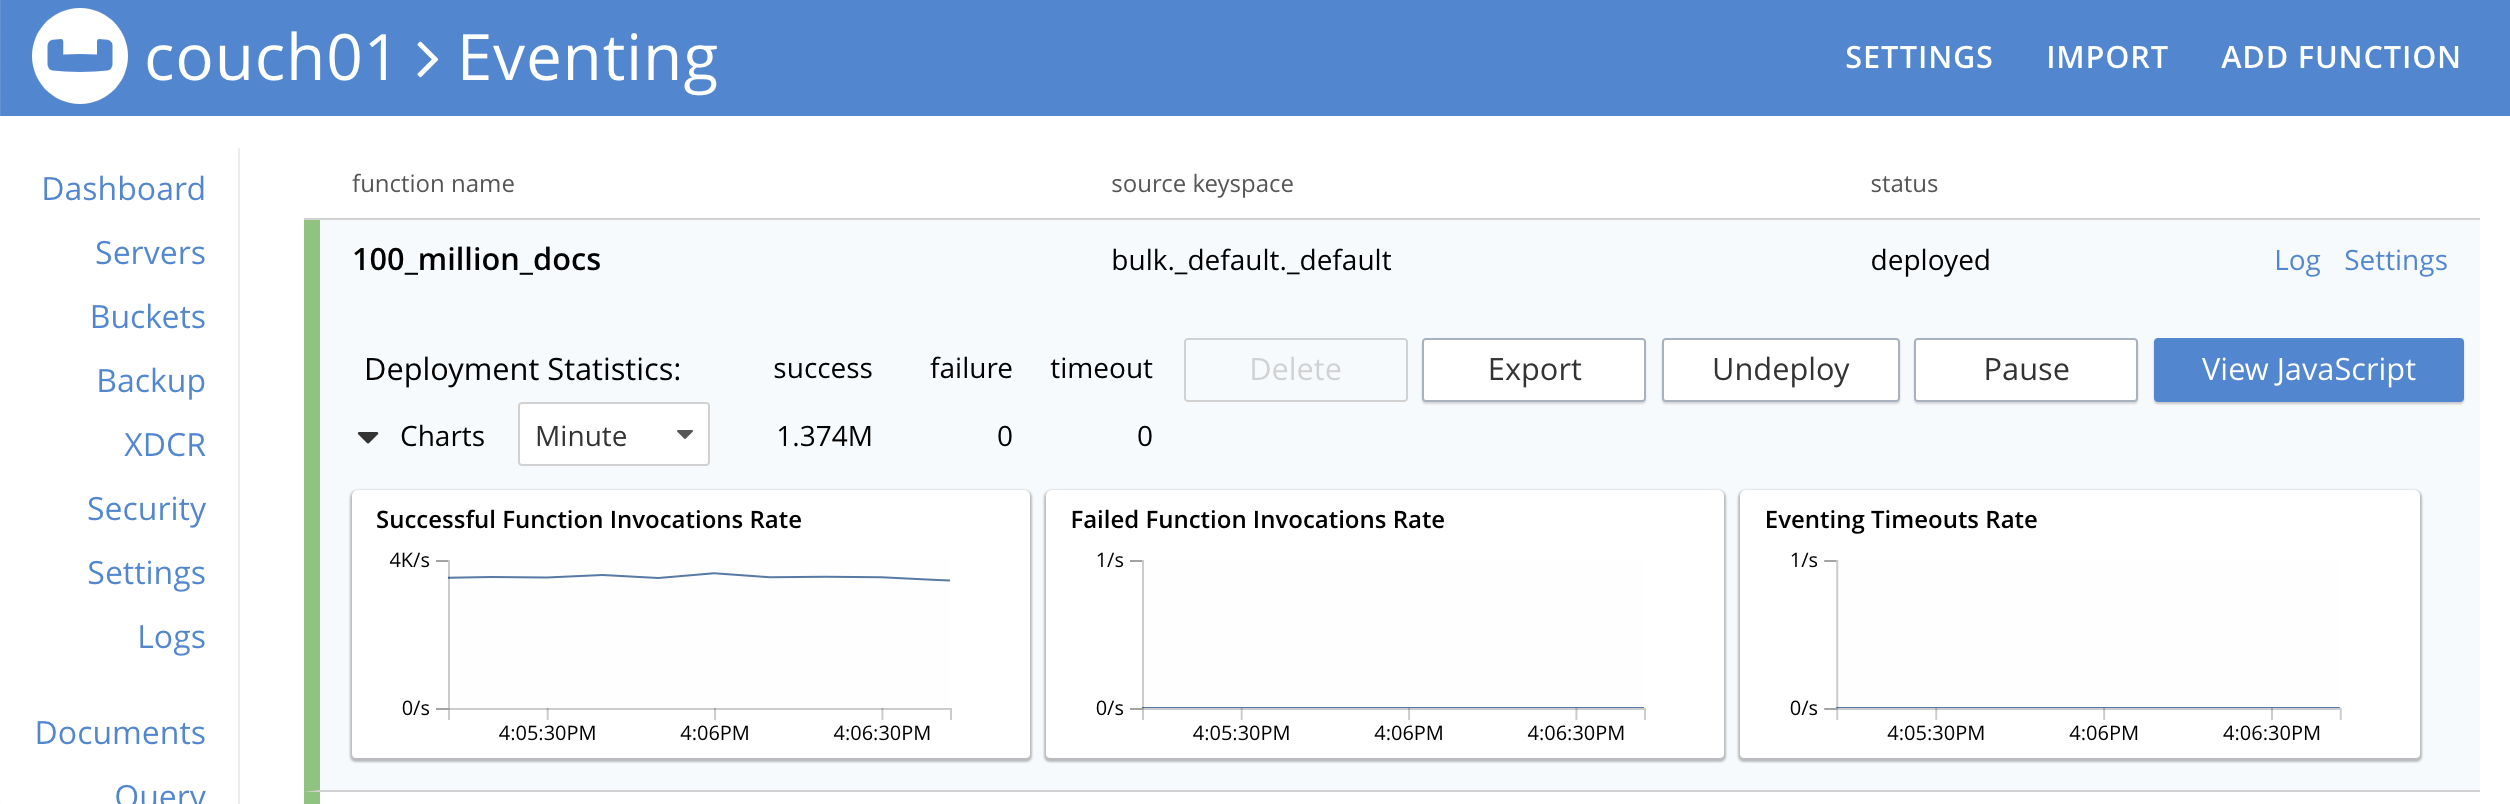
In addition to the per Function numeric statistics above as of 7.0.0 there are the rate charts that can be accessed from any deployed function. These charts are lagged by 30 seconds.
-
success - displays the rate of processed Functions and also Eventing timer callbacks.
-
failure - displays the rate of failures while processing the Function Eventing Function code.
-
timeout - displays the rate of Functions which have encountered a timeout condition.
In addition, per Function Statistics the Web Console or using the REST API.
Via the Web Console’s custom Dashboards
Eventing Statistics, for each deployed Function, can be fetched from an Eventing node using the Web Console.
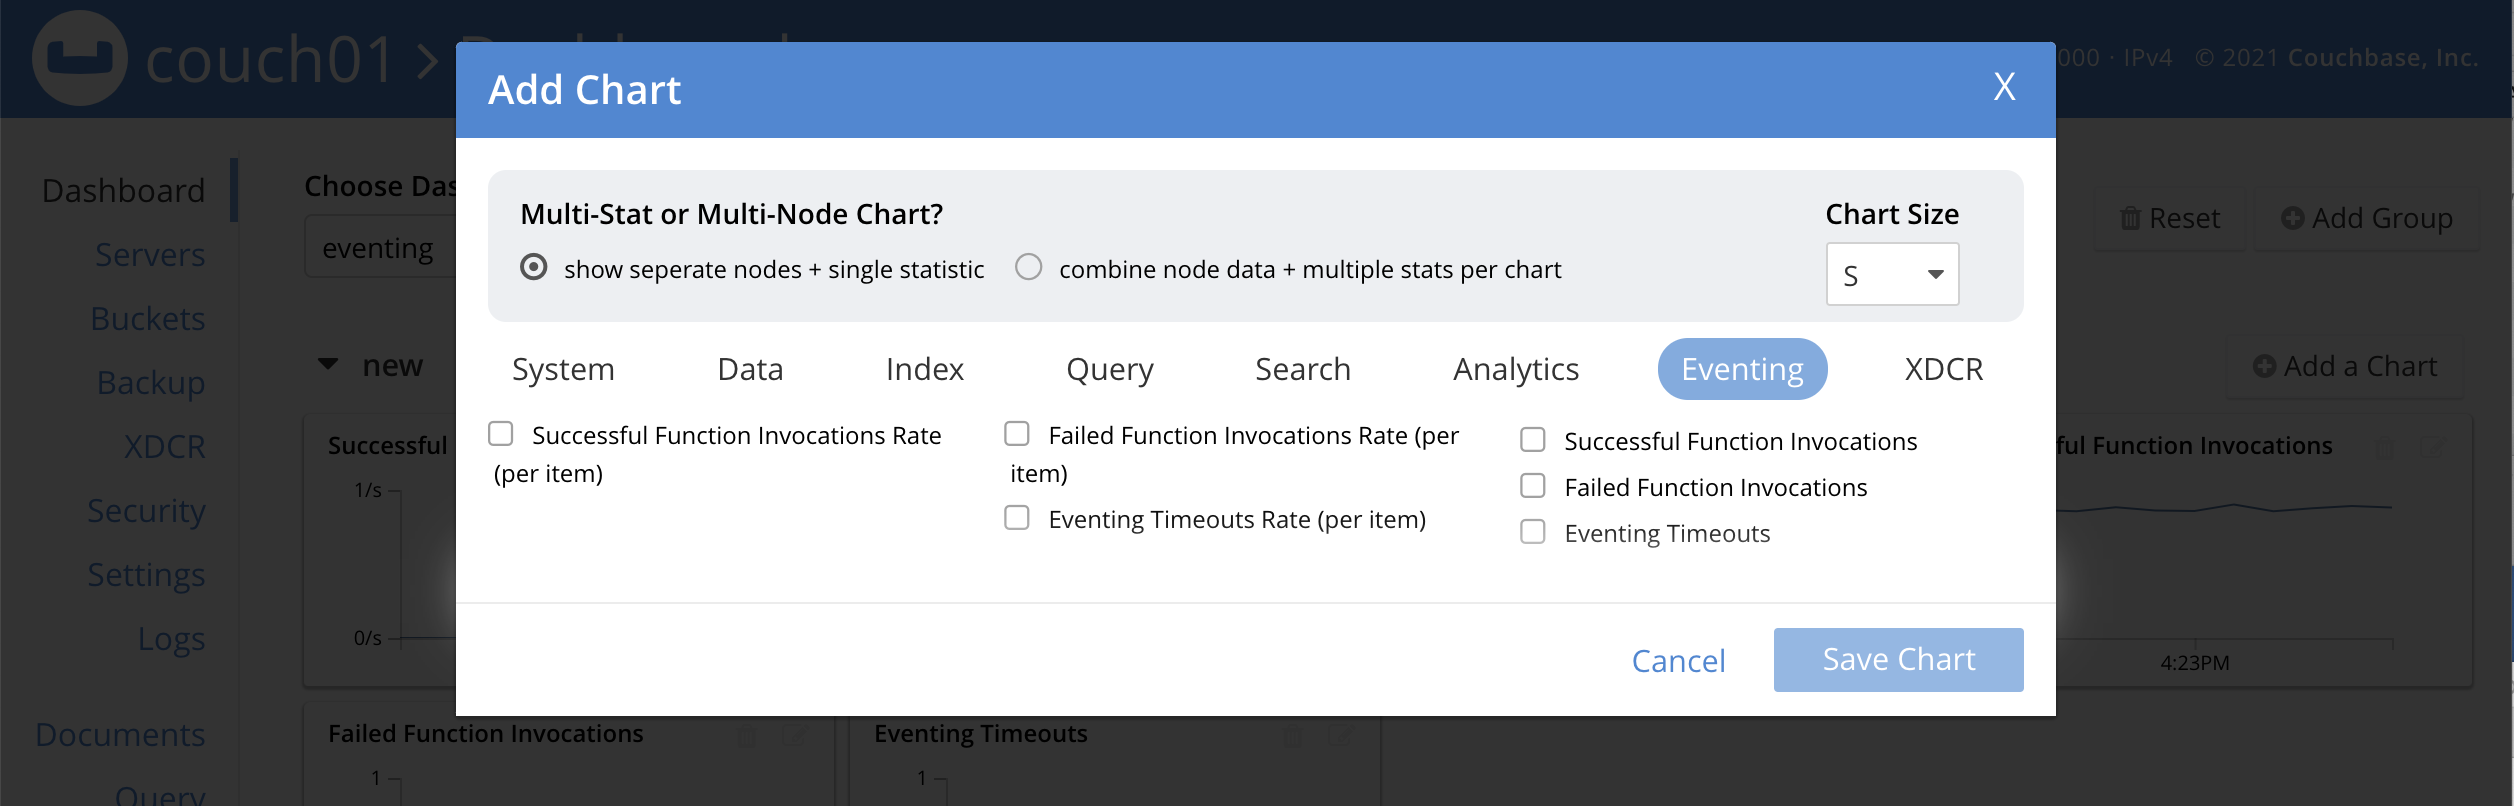
You can make custom dashboards for a node or a cluster to get aggregated Eventing statistics. Access the Couchbase Web Console > Dashboard page. Then select "new dashboard…" from the Choose Dashboard dropdown, then "Add Group" and finally "Add a Chart" (you of course are interested in Eventing charts).
There are six Eventing measures (three rates + three counts) these Dashboard statistics are NOT per bucket and are NOT per function.
-
Successful Function Invocations Rate
-
Failed Function Invocations Rate
-
Eventing Timeouts Rate
-
Successful Function Invocations
-
Failed Function Invocations
-
Eventing Timeouts
An example of all the possible dashboard charts is shown below:
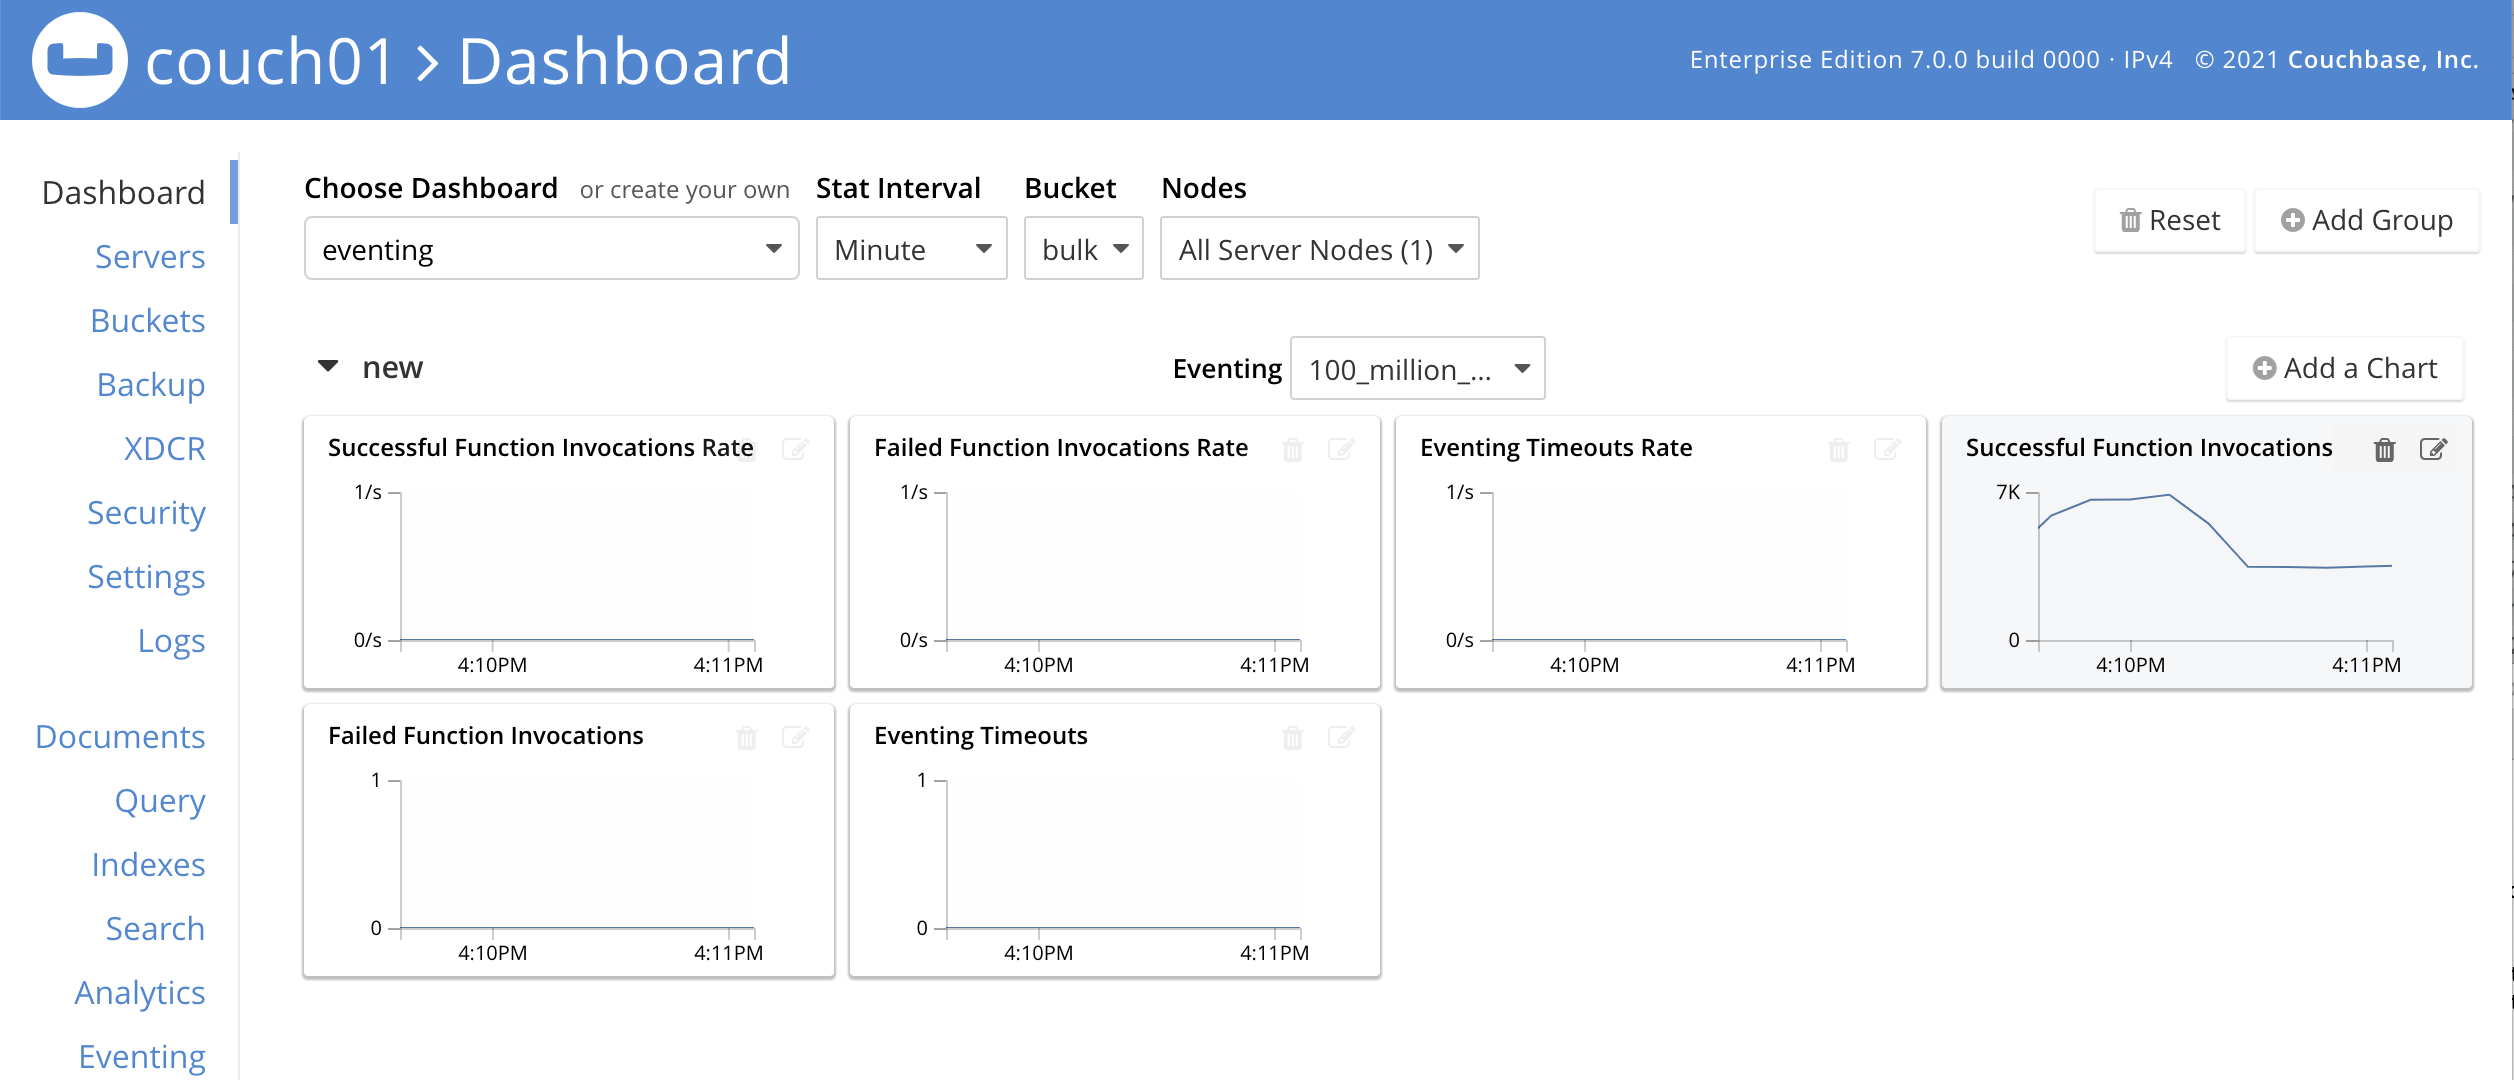
Note, you may click and expand any of the above graphs for any deployed Eventing Function or any Dashboard chart.
Via the REST API
| The Functions REST API endpoints on this page are fully supported, as long as the content of the Eventing Function body is not created or modified externally (as the internal format of the body is not yet standardized). |
Eventing statistics can be fetched from each eventing node using REST API bound to localhost. The resulting JSON based responses are local to the node, and suitable for further aggregation across nodes of the cluster.
The following REST endpoint could be used to get the full set of Eventing statistics:
curl http://user:pass@localhost:8096/api/v1/stats?type=fullThis will return the full statistics set inclusive of events processing, events remaining, execution, failure, latency, worker PIDs and sequence processed.
Note, omitting the parameter type=full will exclude dcp_event_backlog_per_vb, doc_timer_debug_stats, latency_stats, plasma_stats and seqs_processed from the response.
The above statistics can also be individually obtained through the following REST endpoints:
curl http://user:pass@localhost:8096/getExecutionStats?name=function_name
curl http://user:pass@localhost:8096/getLatencyStats?name=function_name
curl http://user:pass@localhost:8096/getFailureStats?name=function_name