Statistics and Monitoring
Couchbase provides detailed statistics about the FTS indexes. Users of the full text search service might also want to monitor the currently running active queries. Monitoring helps get insights into slow queries, or for other debugging purposes.
Monitor Search Index Statistics
The statistics include various metrics that explain the performance of the search query based on the selected FTS index.
Hold the mouse pointer on each chart to view the statistical details corresponding to the chart. Additionally, click the chart to expand the chart in full view.
Couchbase provides statistics for the FTS indexes on the Dashboard page and the Search page.
Dashboard Page
To view the statistics on the Dashboard page:
-
In the left pane, click Dashboard.
-
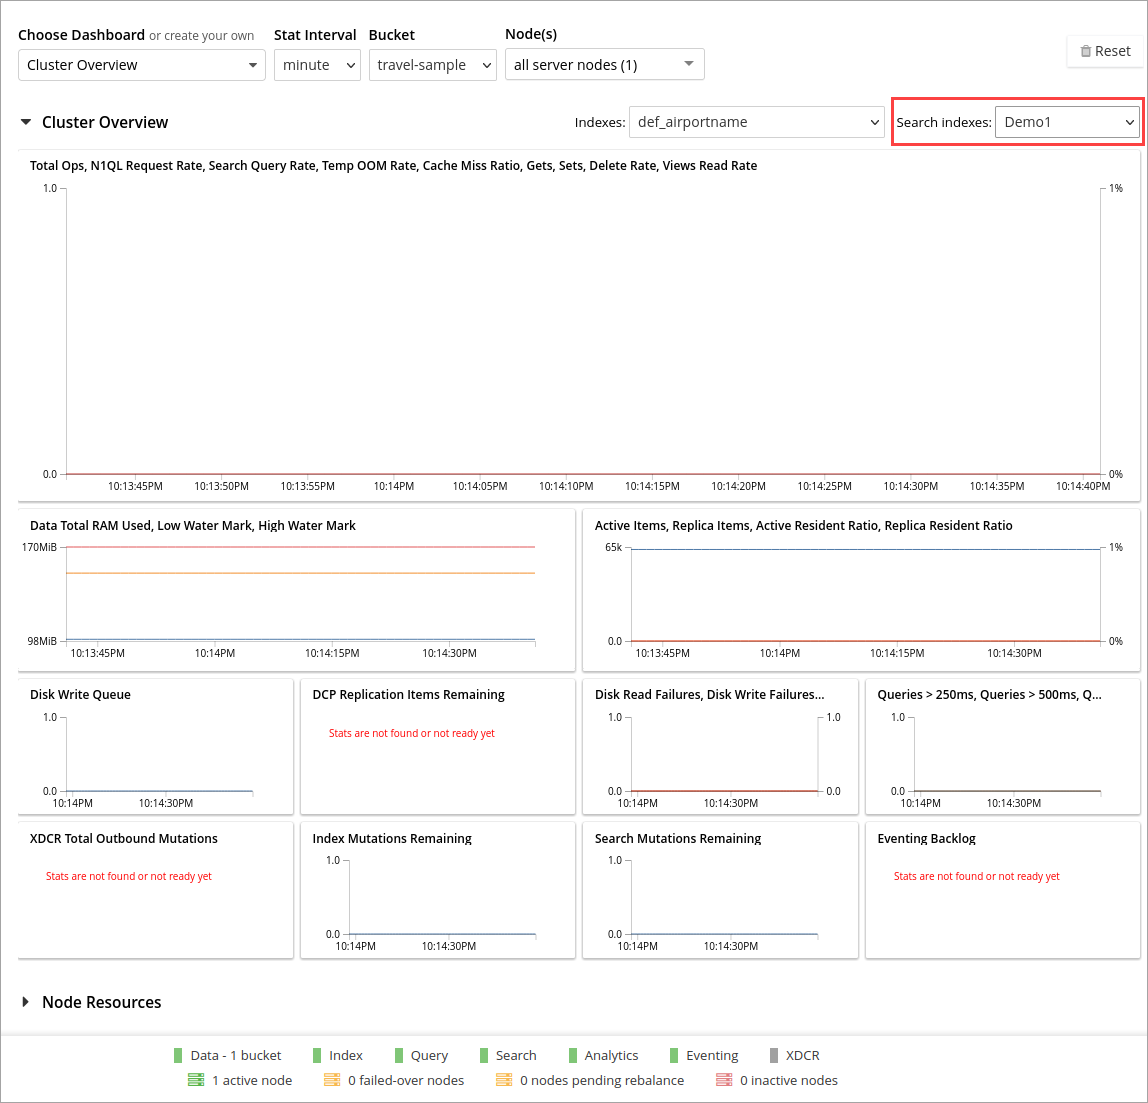
On the Dashboard page, click the Search indexes drop-down list and select the FTS index you want to view the statistics.
A graphical display of the statistics is as shown below:

The statistics display the following graphical charts for FTS index: * Search Mutations Remaining: The number of mutations that have not yet been indexed.
Search Page
To view the statistics on the Search page:
-
In the left pane, click Search.
-
On the Full Text Indexes page, click the full text search index name in the Index Name column.
-
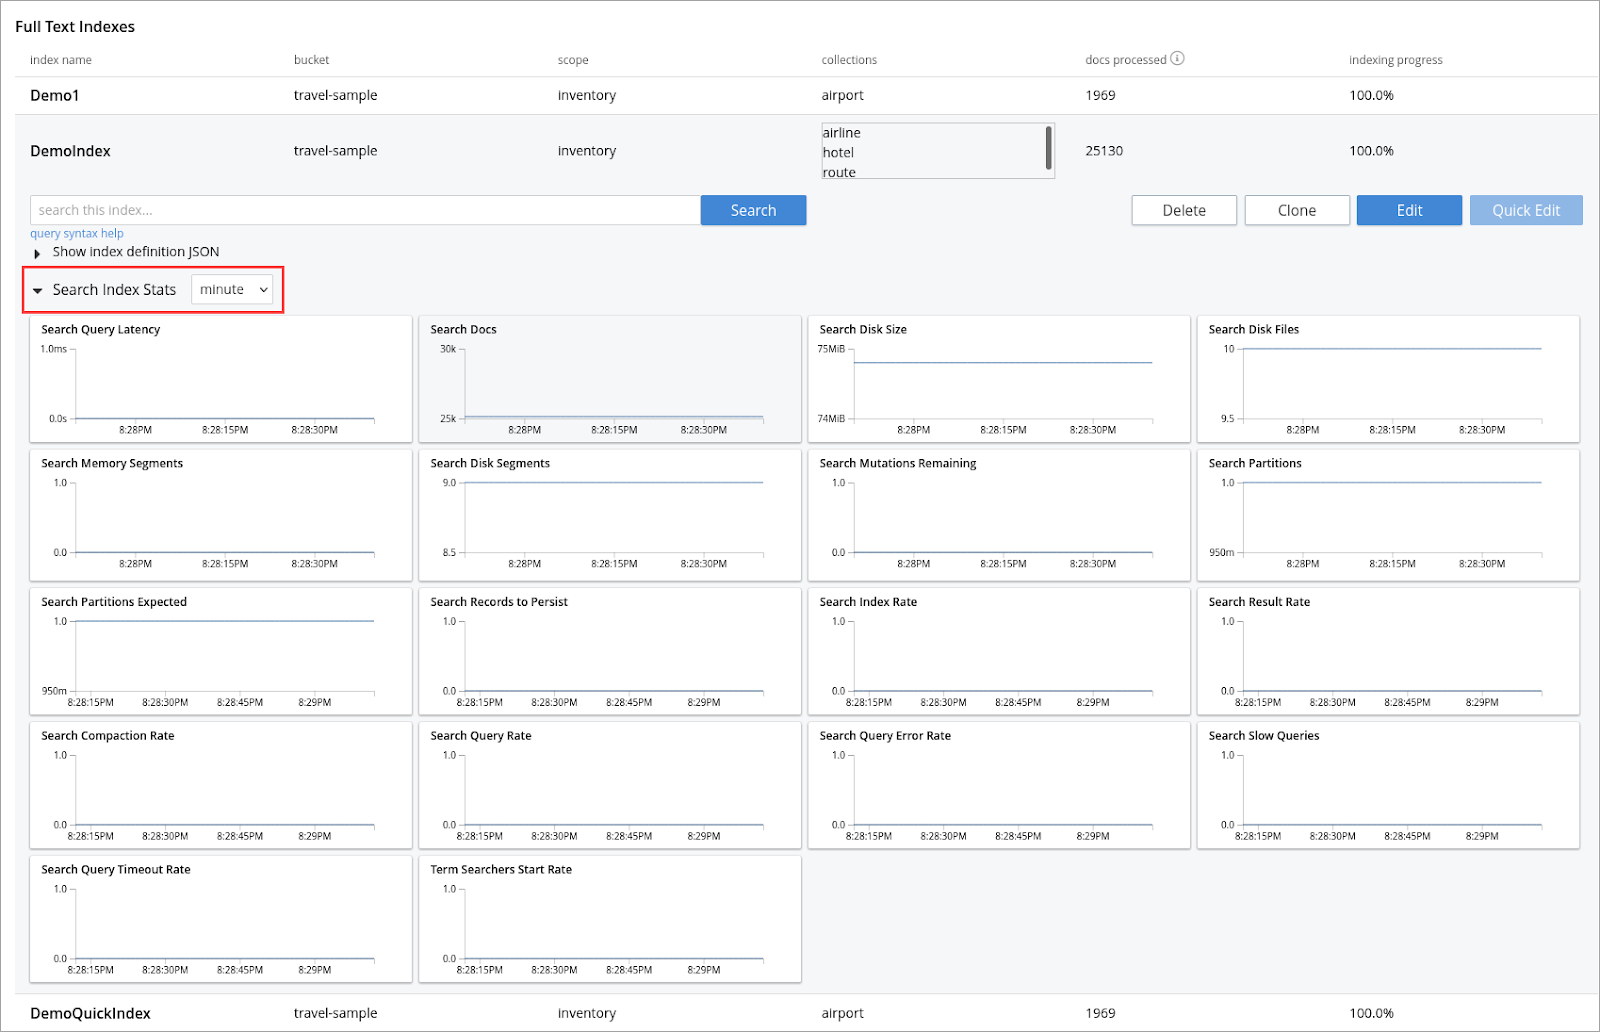
Click the Search Index Stats drop-down arrow to display the statistics.
-
(Optional) Click the interval drop-down list and select the time interval to view the statistics. By default, you can view the statistics for every minute.
A graphical display of the statistics is shown below:

The statistics display the following graphical charts:
-
Search Query Latency: The average time to run the search query and get a response.
-
Search Docs: The number of documents processed during the indexing.
-
Search Disk Size: The total size of disk space occupied by the fts index.
-
Search Disk Files: The number of index files on disk.
-
Search Memory Segments: The number of memory segments in the full text search index across all partitions.
-
Search Disk Segments: The number of disk segments in the full text search index across all resident disk partitions.
-
Search Mutations Remaining: The number of mutations that have not yet been indexed.
-
Search Partitions: The number of actual index partitions.
-
Search Partitions Expected: The number of partitions expected to be scanned for the search query.
-
Search Records to Persist: The number of index records not yet persisted to the disk.
-
Search Index Rate: The rate (In Bytes per second) of indexing plain text.
-
Search Result Rate: The rate (In Bytes per second) of returning the search result.
-
Search Compaction Rate: The rate (In Bytes per second) of compaction of the index segments.
-
Search Query Rate: The number of queries run per second.
-
Search Query Error Rate: The number of queries per second (Including timeouts) that resulted in an error.
-
Search Slow Queries: The number of queries that run slowly (Greater than 5 seconds to run) per second.
-
Search Query Timeout Rate: The number of queries that timeout per second.
-
Term Searchers Start Rate: The number of term searchers started per second.
API Query Index
/api/query/index/{indexName}
The users can use the /api/query/index/{indexName} endpoint to get the details of all the active queries for any given FTS index in the system. With this endpoint, the users can also use the longerThan argument to filter the queries running beyond the given span of time.
The longerThan duration string is a signed sequence of decimal numbers, each with optional fraction and a unit suffix, such as "20s", "-1.5h" or "2h45m". Valid time units are "ns", "us" (or "µs"), "ms", "s", "m", "h".
For example:
curl -XGET -H "Content-Type: application/json" -u <username>:<password> \
'http://localhost:8094/api/query/index/<indexName>?longerThan=1ms'{
"status":"ok",
"totalActiveQueryCount":3,
"filteredActiveQueries":{
"indexName":"DemoIndex",
"longerThan":"1s",
"queryCount":3,
"queryMap":{
"4":{
"QueryContext":{
"query":{
"query":"ipa"
},
"size":10,
"from":0,
"timeout":10000,
"index":"DemoIndex"
},
"executionTime":"17.340715297s"
},
"5":{
"QueryContext":{
"query":{
"query":"german"
},
"size":10,
"from":0,
"timeout":10000,
"index":"DemoIndex"
},
"executionTime":"9.561917571s"
},
"6":{
"QueryContext":{
"query":{
"query":"pale ale"
},
"size":10,
"from":0,
"timeout":10000,
"index":"DemoIndex"
},
"executionTime":"1.239720897s"
}
}
}
}API query
/api/query
The users can use the /api/query endpoint to get the details of all the active queries in any FTS node in a cluster. For example:
curl -XGET -H "Content-Type: application/json" -u <username>:<password> http://localhost:8094/api/query{
"status":"ok",
"totalActiveQueryCount":3,
"filteredActiveQueries":{
"queryCount":3,
"queryMap":{
"10":{
"QueryContext":{
"query":{
"query":"american"
},
"size":10,
"from":0,
"timeout":10000,
"index":"DemoIndex1"
},
"executionTime":"9.700851426s"
},
"11":{
"QueryContext":{
"query":{
"query":"russian"
},
"size":10,
"from":0,
"timeout":10000,
"index":"DemoIndex2"
},
"executionTime":"2.216451567s"
},
"9":{
"QueryContext":{
"query":{
"query":"german"
},
"size":10,
"from":0,
"timeout":10000,
"index":"DemoIndex"
},
"executionTime":"13.863849125s"
}
}
}
}The api/query endpoint takes an optional argument longerThan.
With this argument, the users can filter the queries running beyond the given span of time.
For example,
curl -XGET -H "Content-Type: application/json" -u <username>:<password> 'http://localhost:8094/api/query?longerThan=10s'{
"status": "ok",
"totalActiveQueryCount": 0,
"filteredActiveQueries": {
"indexName": "DemoIndex",
"queryCount": 0,
"queryMap": {}
}
}