Monitor
Monitoring of Couchbase Server can be performed by means of Couchbase Web Console, the CLI, and the REST API.
This page summarizes the options available for monitoring Couchbase Server and provides links to more detailed interface-descriptions.
Monitoring with the UI
Couchbase-Server statistics can be monitored by means of Couchbase Web Console.
Users with the Full Admin or Bucket Admin role can assemble statistics as groups of charts, on the Dashboard of Couchbase Web Console. This is visible by default after login; and can at any time be displayed by left-clicking on the Dashboard tab, in the left-hand navigation bar:
Note that the UI returns the last 30 days of statistics.
Initially, prior to any definitions having been made, the Dashboard appears as follows:
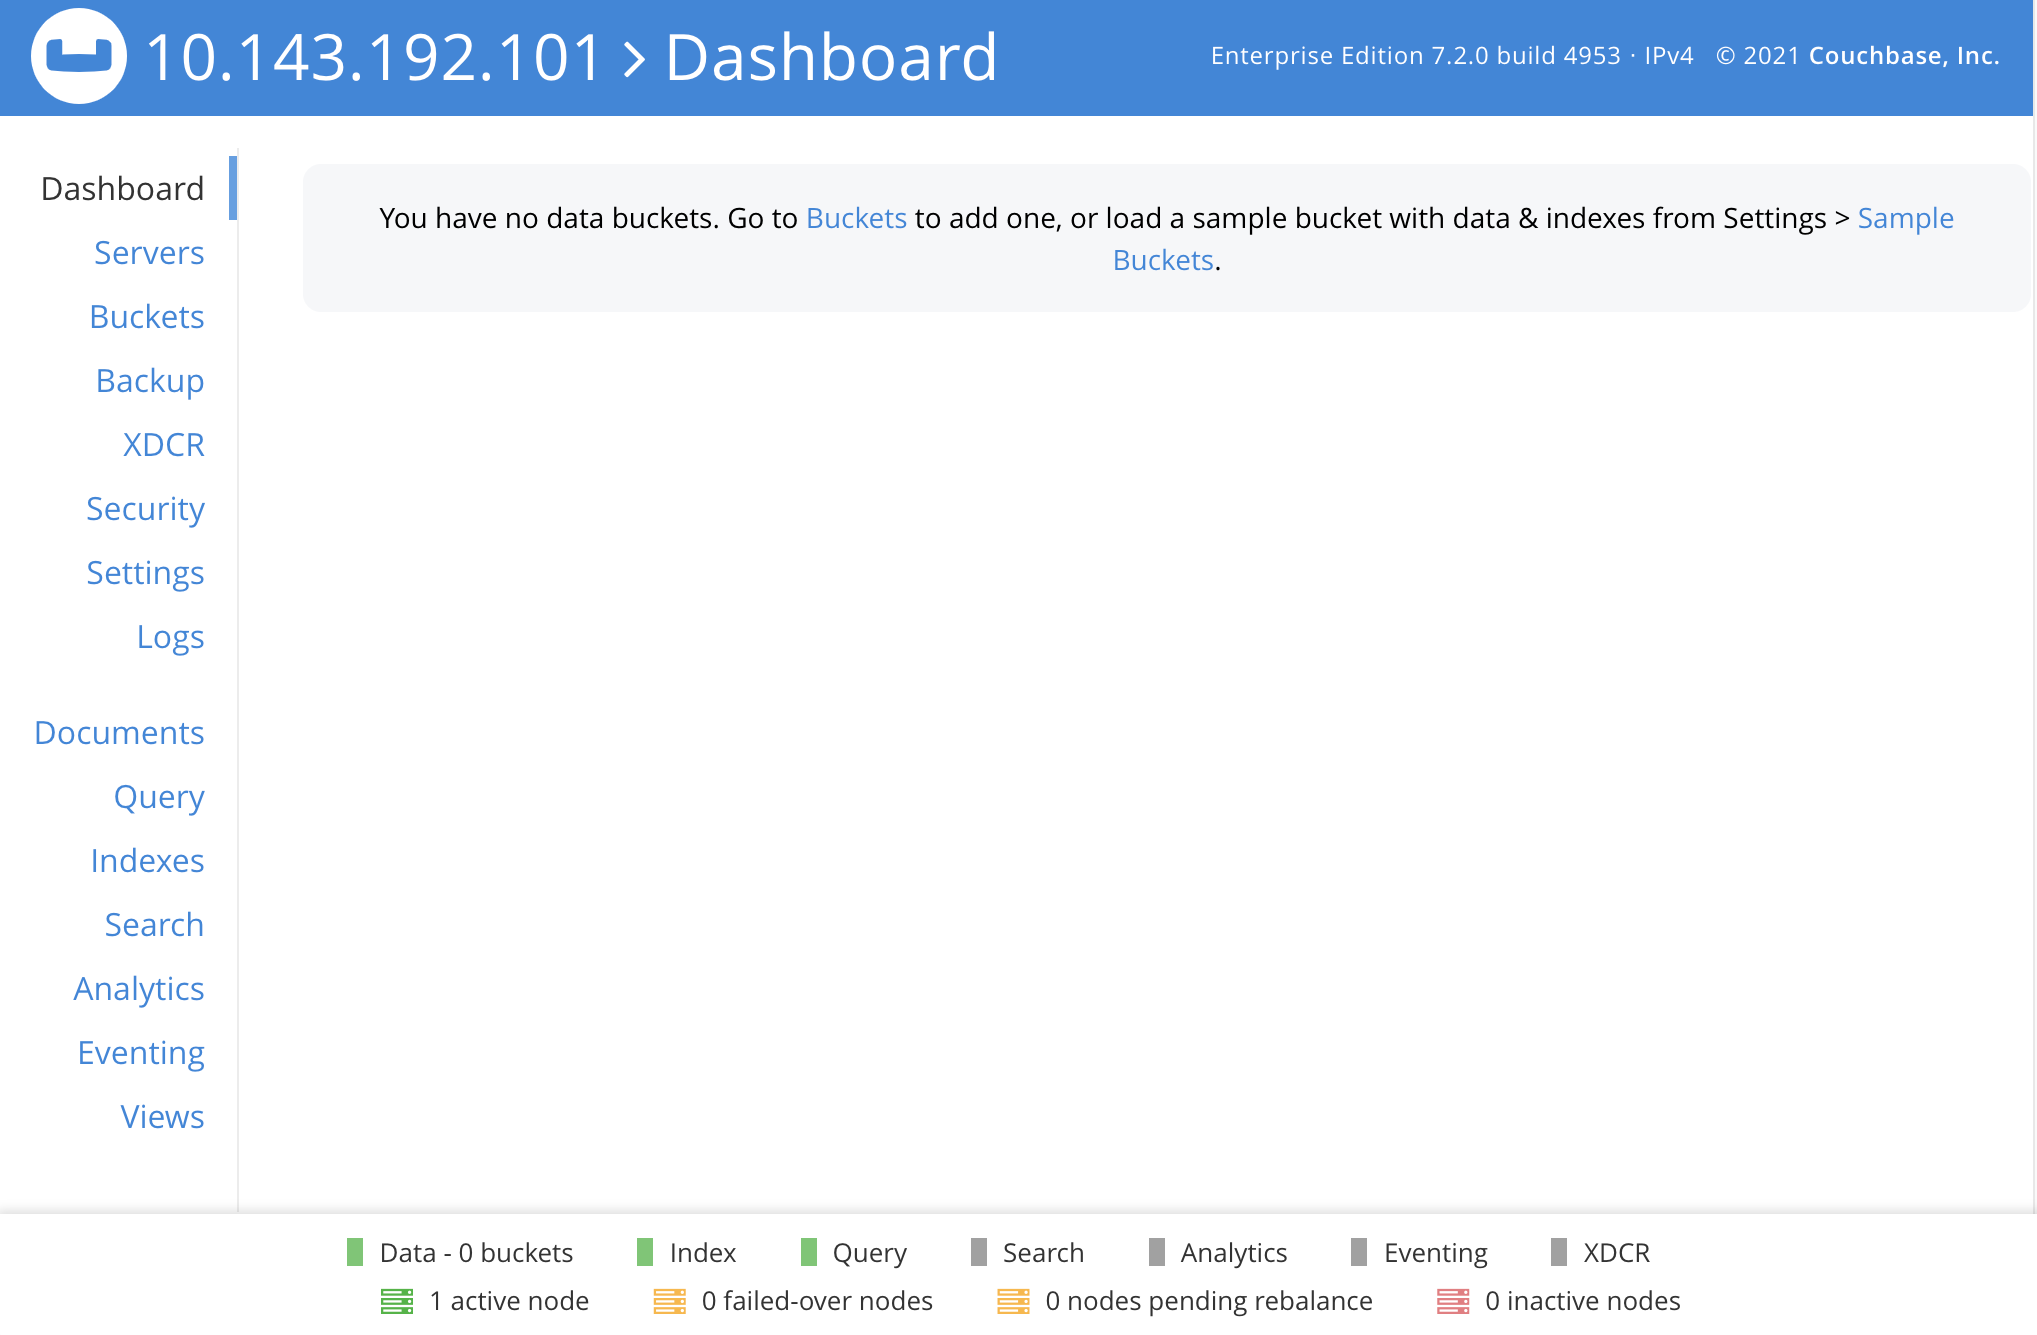
From this point, charts can be assembled interactively, and statistics for Couchbase Server and all services thereby monitored. For step-by-step instructions, see Manage Statistics.
Monitoring with cbstats
The cbstats tool provides Data-Service statistics, for an individual, specified node.
The complete interface for cbstats is documented in cbstats.
Monitoring with the REST API
Couchbase Server provides a REST API for Getting Cluster Statistics. Statistics are retrieved based on the specification of one or more metrics. Optionally, the statistics can be further defined through the specifying of a function; and/or labels with values. An instance of Prometheus runs on each node of the cluster, and the metrics for each node are duly stored in that node’s instance of Prometheus.
For a complete list of metrics, see the Metrics Reference.
Additional Monitoring Options
Statistics for the Index Service can be managed by means of Couchbase Web Console: this is described in Monitor Indexes.
The monitoring of statistics related to the Query Service is described in Manage and Monitor Queries.
The progressive desynchronization of nodes whose clock has been previously synchronized can be monitored, as described in Monitor Clock Drift.
Monitoring Couchbase Metrics with Prometheus
It’s also possible to set up a Prometheus monitor to consume metrics data from a Couchbase cluster. You can find an introduction on how to do this in Configure Prometheus to Collect Couchbase Metrics