Manage Logging
The Logging facility allows a record to be maintained of important events that occur on Couchbase Server.
Logging Overview
The Couchbase Server records important events and saves the details to log files on disk. You can directly view the log files on each node in the cluster. Each operating system has its own default location for log files:
| Operating System | Log Path |
|---|---|
Linux |
|
MacOS |
|
Windows |
|
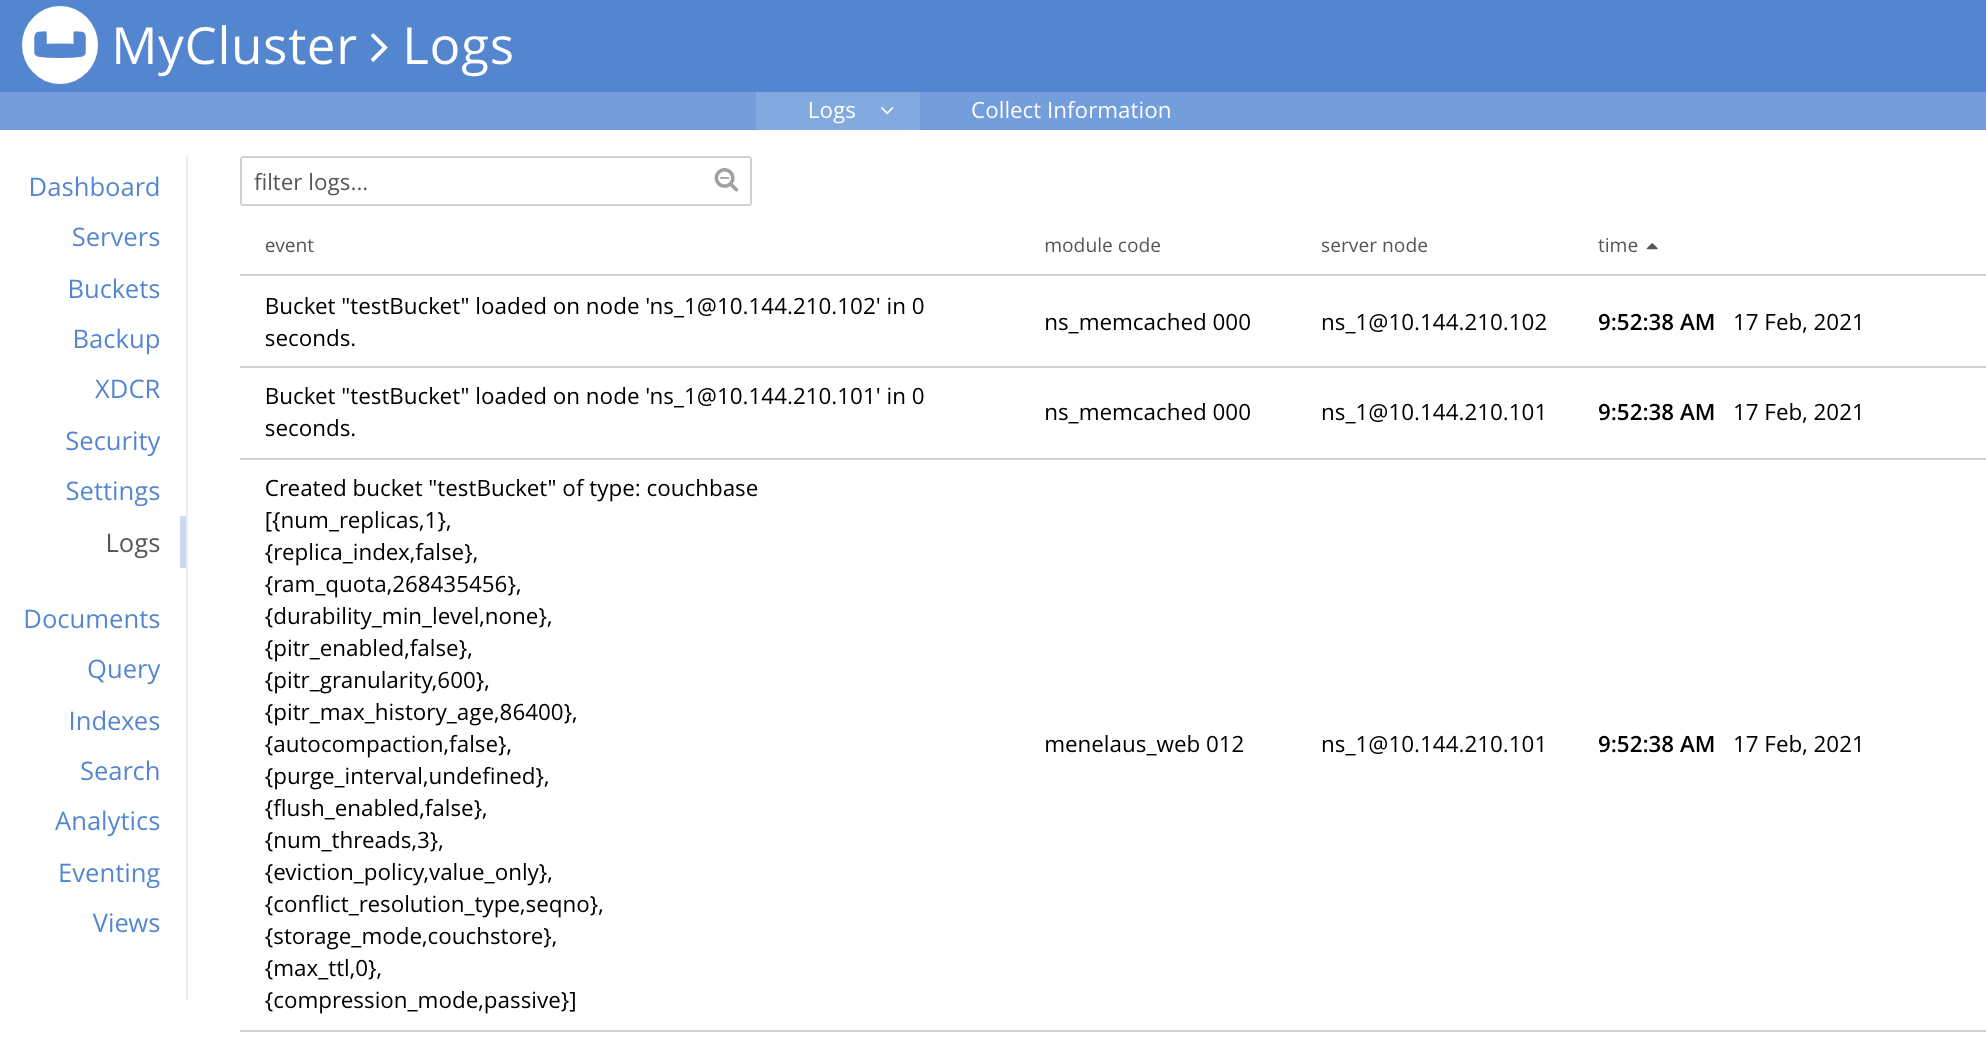
You can also view a summary of log events in Couchbase Server Web Console by clicking Logs.
Log Files
Each node in the cluster saves several different log files to the log directory.
The following table lists these files.
Unless otherwise specified, each file has a .log extension.
| File | Log Contents |
|---|---|
|
Security audit log for administrators. |
|
Information about access attempts made to the REST/HTTP port of the Analytics Service. |
|
Debugging information about the Analytics Service. |
|
DCP-specific debugging information about the Analytics Service. |
|
Information about documents that failed to be imported/ingested from the Data Service into the Analytics Service. |
|
Events logged by the Analytics Service at the |
|
Events logged by the Analytics Service at the |
|
Events logged by the Analytics Service at the |
|
Logs optimization information for the Analytics Service. |
|
Periodic dumps of internal Java state for the Analytics Service. |
|
Logs Analytics Service shutdown events. |
|
Highly-detailed events logged by the Analytics Service at the |
|
Events logged by the Analytics Service at the |
|
Troubleshooting log for the babysitter process that spawns and respawns all Couchbase Server processes. |
|
Log for Backup Service events, including |
|
Troubleshooting log for the |
|
Debug-level troubleshooting for the Cluster Manager. |
|
Error-level troubleshooting log for the Cluster Manager. |
|
Troubleshooting log for the Eventing Service. |
|
Troubleshooting log for the Search Service. |
|
Troubleshooting log for XDCR source activity. |
|
The HTTP access log records server requests (including administrator logins) to the REST API or Couchbase Web Console. It uses common log format and contains important fields such as remote client IP, timestamp, GET/POST request and resource requested, HTTP status code, and more. |
|
The internal HTTP access log records internal server requests (including administrator logins) to the REST API or Couchbase Web Console. It uses common log format and contains important fields such as remote client IP, timestamp, GET/POST request and resource requested, HTTP status code, and more. |
|
Troubleshooting log for the Index Service. |
|
Log containing statistics related to the Index Service. |
|
Info-level troubleshooting log for the Cluster Manager. Clients can also log informational messages to this file using the client-side error logging API. |
|
Log used by the Cluster Manager. |
|
Contains JavaScript and other view-processing errors. |
|
Contains information about the core Memcached component, including DCP stream requests and slow operations. You can adjust the logging for slow operations. See Adjusting Threshold for Logging Slow Operations for details. |
|
Troubleshooting log for the |
|
Contains information about starting up the |
|
Troubleshooting log for the projector process, which sends appropriate mutations from Data Service nodes to Index Service nodes. |
|
Log containing statistics related to the projector process. |
|
Log for the instance of Prometheus that runs on the current node, supporting the gathering and management of Couchbase Server metrics. See the Metrics Reference for more information about metrics. |
|
Troubleshooting log for the Query Service. |
|
A directory that contains reports about rebalances that have occurred.
This directory retains reports on up to the last 5 rebalances.
Each report’s filename contains the date and time it ran.
For example, |
|
Contains events and crash reports for the Erlang processes. Erlang processes crash and restart upon an error. |
|
Troubleshooting log for the SSL proxy spawned by the Cluster Manager. |
|
Contains periodic statistic dumps from the Cluster Manager. |
|
Highly-detailed troubleshooting log for the Cluster Manager. |
|
Troubleshooting log for the views engine, mainly logging the changing of partition states. |
|
Troubleshooting log for data received from XDCR sources. |
| Additional log files may exist in the log directory. These files are often empty unless you have enabled specific debugging options. You usually only enable these settings at the request of Couchbase Support. Some logs in preceding table do not appear in the log directory of a node where you have not enabled the associated feature or service associated with it. |
Changing Log File Locations
It’s possible to change the location where Couchbase Server saves log files.
However, Couchbase only supports the default log location.
Changing the log location requires manually editing a configuration file named static_config.
This file only controls the log location on the node where you make the change.
Therefore, to make the change in your entire cluster, you edit static_config on every node.
If you add new nodes to the cluster, you must remember to make the changes to their copies of the static_config file.
The Couchbase Server upgrade process can overwrite the static_config file, losing any of your modifications.
If you change the log location, you may need to reapply your changes after an upgrade.
If your goal is to store logs on a different filesystem, consider symbolically linking the log directory to a directory in the target filesystem instead.
Another option is to directly mount the filesystem under the default log location.
In either case, make sure the user who owns the Couchbase Server files has read and write permissions to the target filesystem.
These options are more durable than changing the log location in static_config.
If neither of these options meet your needs, you can change the log location by following these steps:
-
Log into a node as
rootor the user who owns the Couchbase Server files. You can also usesudoto gain the necessary permissions. -
Edit the
static_configwith your preferred text editor. This file is located in theetc/couchbasedirectory under the Couchbase installation directory. For example:/opt/couchbase/etc/couchbase/static_configon Linux systems. -
Locate the
error_logger_mf_dirvariable, and change the value to the path where you want Couchbase Server to save log files. For example, to change the log path to/var/logs/couchbase, modify the entry as follows:{error_logger_mf_dir, "/var/logs/couchbase"}. -
Stop and restart Couchbase Server. See Start and Stop Couchbase Server for the steps to restart Couchbase Server.
-
Repeat steps 1 through 4 on each node where you want to change the log path.
Log File Rotation
Couchbase Server rotates log files to prevent them from consuming too much disk space. It keeps a limited number of past log files in compressed format for reference. Once it reaches the limit on the number of logs files to keep, Couchbase Server deletes the oldest log file.
In Couchbase Server 8.0 and later, Memcached log retention is based on total disk usage (aggregated size) rather than a fixed number of rotated files. By default, the Memcached log rotates when it reaches ~10 MB.
Couchbase Server retains multiple rotated Memcached log files until the combined size of all retained files exceeds a configured aggregate limit. When you exceed the aggregated size limit, Couchbase Server removes the oldest rotated files as part of the next rotation cycle. The default aggregate retention cap is 200 MB.
In addition to size-based rotation, Couchbase Server starts a new Memcached log file when:
-
You restart a Memcached process
-
You enable or disable encryption for Memcached logs
-
You enable encryption for Memcached logs and a key rotation occurs
Couchbase Server versions earlier than 8.0 rotates non-Memcached log files automatically when they reach 40 MB. It keeps the current version of the log, plus up to 9 compressed past logs.
Changing Log Rotation Settings
You can change log rotation settings by editing the static_config configuration file.
This file only controls the log rotation settings on the node where you make the change.
It does not propagate to other nodes in the cluster.
Couchbase Server upgrades can overwrite static_config, losing any of your modifications.
|
In Couchbase 8.0+, Memcached log rotation uses internal configuration and an aggregate‑size retention limit, which you may not be able to configure in all releases.
To change log rotation settings for non-Memcached logs, follow these steps:
-
Log into a node as
rootor the user who owns the Couchbase Server files. You can also usesudoto gain the necessary permissions. -
Edit the
static_configfile with your preferred text editor. This file is in theetc/couchbasesubdirectory of the Couchbase Server installation directory. For example:/opt/couchbase/etc/couchbase/static_configon Linux systems. -
Add or edit an entry for the log file whose rotation settings you want to change. The format for the entry is:
{disk_sink_opts_disk_<log_file>,
  [{rotation, [{size, <size_in_bytes>},
  {num_files, <number_of_log_files_to_keep>}]}]}.
Replace the following placeholders with the values for the log you want to rotate:
-
<log_file>: The name of the log file without the.logextension, as shown in table in Log Files. For example, usedebugfor thedebug.logfile. -
<size_in_bytes>: The size in bytes at which to rotate the log file. -
<number_of_log_files_to_keep>: The number of log files to keep, including the current log file.
For example, to change the rotation settings for the
debug.logfile to rotate at 10MB and keep 10 copies of the log, add the following entry:{disk_sink_opts_disk_debug, [{rotation, [{size, 10485760}, {num_files, 10}]}]}. -
-
Stop and restart Couchbase Server. See Start and Stop Couchbase Server for the steps to restart Couchbase Server.
-
Repeat steps 1 through 4 on each node where you want to change the log rotation settings.
Logging Levels
Logging levels control the level of detail that Couchbase Server writes to its log files. The higher the logging level, the more detailed the log entries. However, higher logging levels also consume more disk space. You can change logging levels for some Couchbase Server components and services.
Changing Logging Levels Through REST APIs
Some components and services in Couchbase Server let you adjust logging levels and other log settings using REST APIs. The following table lists these services and links to the relevant REST API settings:
| Service or Component | REST API settings link | Description |
|---|---|---|
Full-Text Search Service |
Enables or disables verbose logging for the Full-Text Search Service. |
|
Full-Text Search Service |
Enables the FTS to log when a query exceeds a time threshold. |
|
Index Service |
Sets the logging level for the Index Service. |
|
Index Service |
Sets how often the Index Service writes its statistics to the |
|
Index Service |
Sets the logging level for the Index Service’s projector component that provides data to the Index Service. |
|
Query Service |
Sets the logging level for the Query Service. |
| Couchbase Server auditing has its own log settings. See Manage Audit Logs and Events for more information. |
Change Logging Levels via a Configuration File
It’s possible to change the logging level of Couchbase Server components that do not have REST API settings for logging levels. However, you should only do this under the direction of Couchbase Support.
The logging level for Couchbase Server’s internal components is set in the static_config configuration file.
This file contains a series of loglevel_ entries that set the log level of internal Couchbase Server components.
This file only controls the log levels on the node where you make the change.
If you need to make the change on multiple nodes, you must edit the file on each node.
Couchbase Server upgrades can overwrite static_config, losing any modifications you have made.
|
To change the logging level for a component, follow these steps:
-
Log in as
rootorsudoto a user that has write permissions for the Couchbase Server installation directories. -
Edit the
static_configfile with your preferred text editor. This file is in theetc/couchbasesubdirectory of the Couchbase Server installation directory. For example:/opt/couchbase/etc/couchbase/static_configon Linux systems. -
Edit the
loglevel_<log_component>entry to set the logging level requested by Couchbase Support. -
Save the file and exit the text editor.
-
Stop and restart Couchbase Server. See Start and Stop Couchbase Server.
-
Repeat steps 1 through 5 on each node where you need to change the logging level.
Collect Logs
You can collect logs to share with Couchbase Support using the command line, REST-API, or the Couchbase Server Web Console. This process gathers the most up-to-date log information from the nodes in the cluster. It includes additional diagnostic information not included in the log files stored in the logs directory. Couchbase Server saves the collected log files as zip files in a temporary location on each node.
Collecting Logs Using the Command Line
To collect logs, use the cbcollect_info command.
To start and stop log collection and to collect log status, use:
Collecting Logs Using the REST API
The Logging REST API provides endpoints for retrieving log and diagnostic information.
To retrieve log information, use the /diag and /sasl_logs
REST endpoints.
Collecting Logs Using Couchbase Web Console
Administrators with either the Full Admin or Cluster Admin roles can collect logs using Couchbase Server Web Console. On the Logs page, click the Collect Information tab. Administrators without either of these roles do not see this tab.
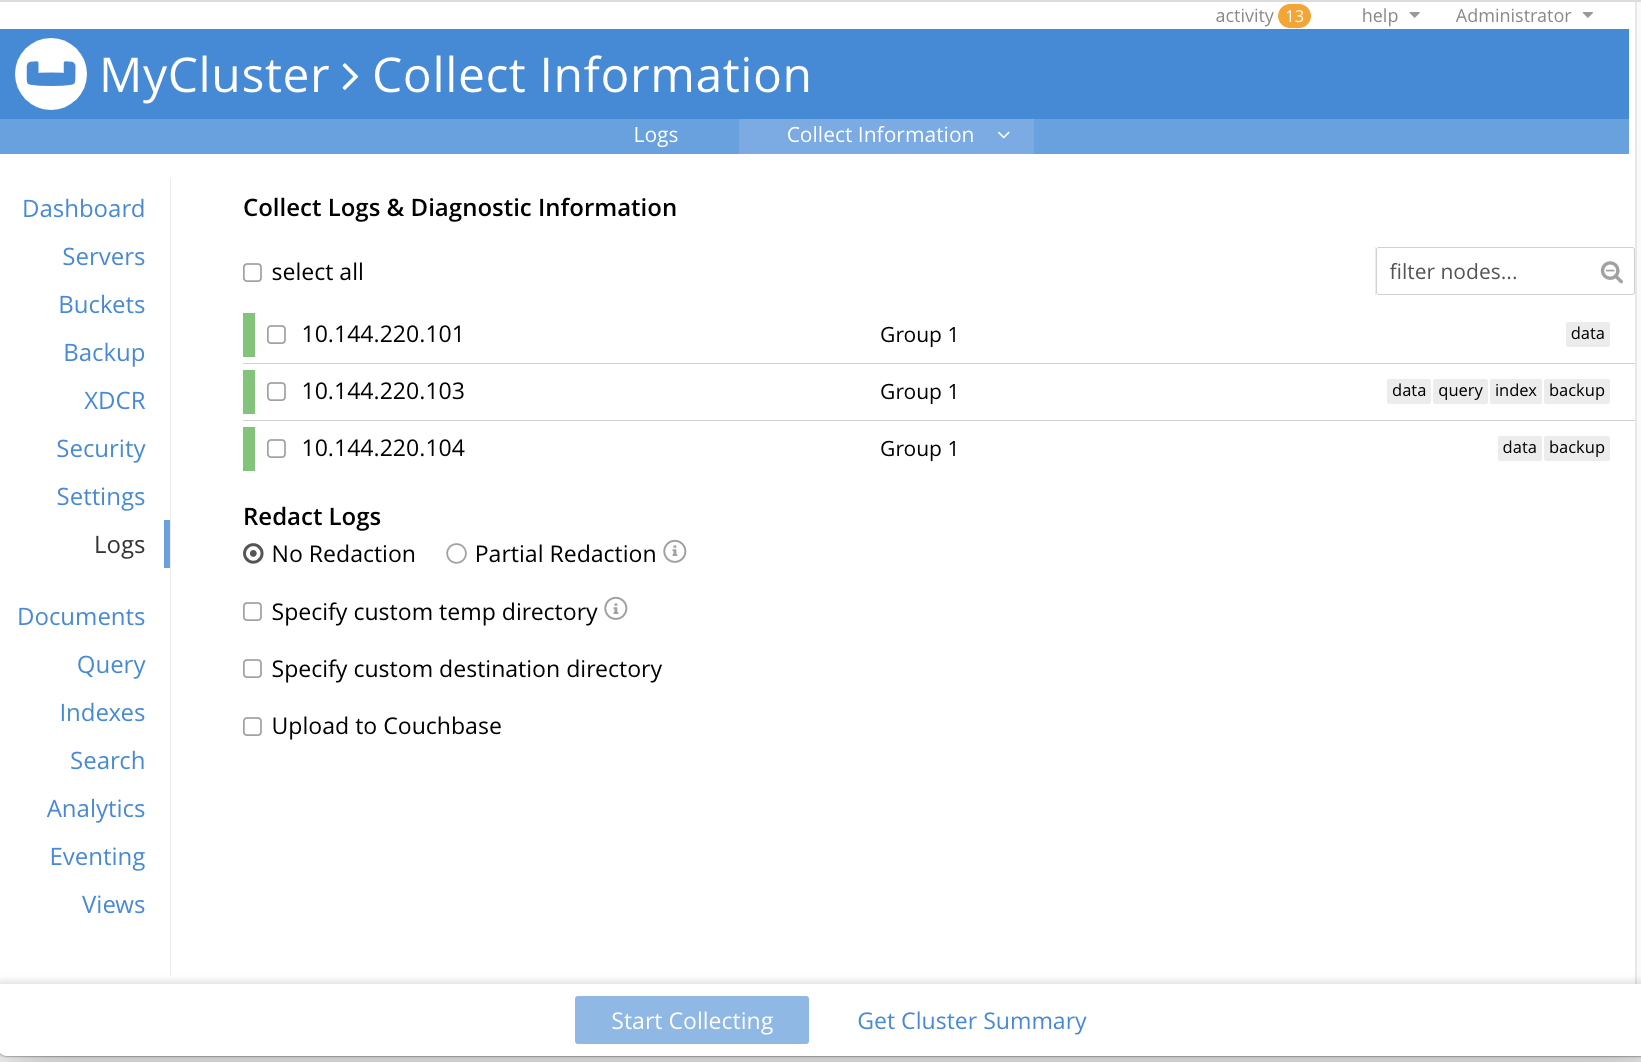
The Collect Information page lets you choose which nodes should perform explicit logging.
If there is an existing collection of log files, you can view them by clicking Show Current Collection. The file names of the existing log file collection contains the date and time they were created and whether the logs are redacted. See Log Redaction for information about redaction.
To collect logs:
-
Select the nodes from which you want to collect logs.
-
Decide whether you want to redact the logs. Redacting hides sensitive information within the logs. See Applying Redaction for more information.
-
Choose whether you want to use a custom temporary directory for Couchbase Server to use when assembling the log collection. You may want to set a custom directory to prevent the collection from using too much disk space on the default temporary directory. If you enable this option, enter an absolute path for the temporary directory. The temporary directory must exist on all nodes from which you’re collecting logs.
-
Decide whether you want to use a custom destination directory for the completed zip files. As with the temporary directory, you may want to set a custom directory to prevent the collection from using too much disk space on the default destination directory. The destination directory must exist on all nodes from which you’re collecting logs.
-
Choose whether you want to encrypt the collected log files. This option is selected by default. When you enable this option, Couchbase Server encrypts the collected log files using AES encryption. You must supply and confirm a password to encrypt the files. If you do not want to encrypt the zip files, clear Encrypt Collected Files.
-
Choose whether you want to upload the collected logs to Couchbase Support. See Uploading Log Files for more information about uploading log files to Couchbase Support.
-
Click Start Collecting to start the collection process.
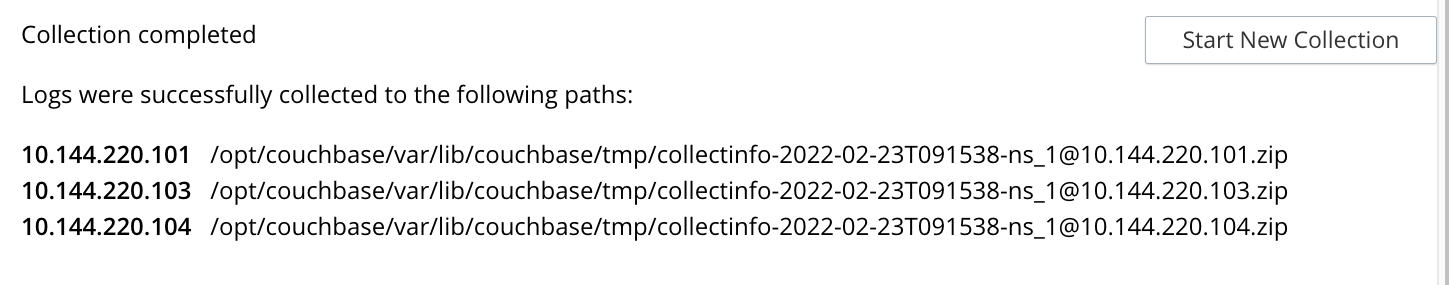
Once you start the collection process, the page clears and shows you a status message letting you know that the collection process is running. A button allows you to stop the collection process. When the collection process completes for a node, the page updates and shows the path for the node’s zip file. When the process completes for all nodes, the page displays a message similar to the following:
After the process completes, the log files are available in the specified destination directory on each node. If you enabled redaction, Couchbase Server creates 2 zip files for each node. One contains the redacted data, and the other contains unredacted data.
Couchbase Server adds the prefix ns_server. to the log files from the log directory.
The additional logs it gathers do not have this prefix.
|
Getting a Cluster Summary
On the Collect Logs & Diagnostic Information tab, you can get a summary of the cluster’s status by clicking Get Cluster Summary. Clicking this link opens the Cluster Summary Info dialog:
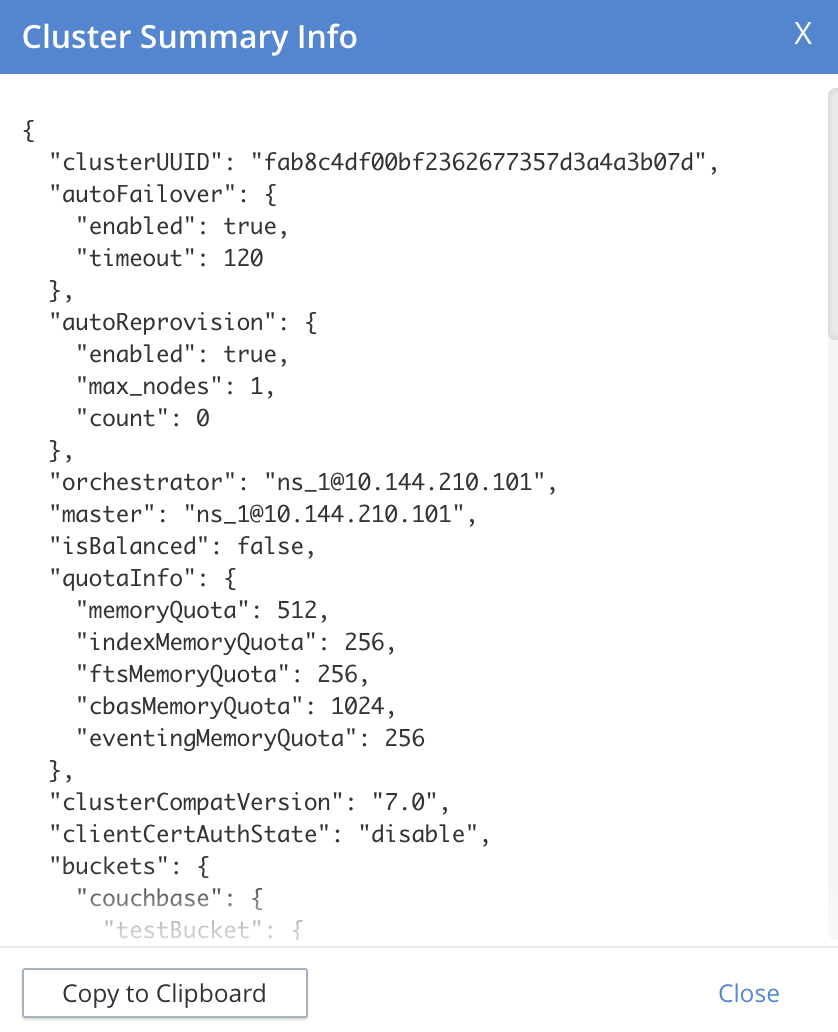
The JSON document in the dialog contains a detailed status report of your cluster’s configuration and status. You can copy this information by clicking Copy to Clipboard. You can then manually share it with Couchbase Support, either in addition to or as an alternative to log collection.
Log Redaction
During the collection process, Couchbase Server scans the log files for private data.
In some log files, it marks sensitive data with the tags <ud> and </ud>.
When you select the Partial Redaction option on the Collect Information tab or use the --log-redaction-level=partial argument with the cbcollect_info command, Couchbase Server redacts the marked data in the collected log files.
Sensitive log data includes:
-
Key/value pairs in JSON documents
-
Usernames
-
Query fields that reference key/value pairs or usernames
-
Names and email addresses retrieved during product registration
-
Extended attributes
When redacting, Couchbase Server replaces the content of the <ud> and </ud> tags with a SHA-1 hashed version of the data.
For example, the following fragment from the debug.log displays 2 pieces of private data: a Couchbase username and a document ID:
[ns_server:debug,2025-11-26T18:47:35.841Z,ns_1@node1.example.com.:ns_audit<0.728.0>:ns_audit
                :handle_call:178]Audit read_doc: [{local,{[{ip,<<"172.18.0.2">>},{port,8091}]}},
                 {remote,{[{ip,<<"192.168.65.1">>},{port,26569}]}},
                 {sessionid,<<"0591ad71ffeb715b208cf7547aa5c97b47a927bb">>},
                 {real_userid,{[{domain,builtin},
                                {user,<<"<ud>Administrator</ud>">>}]}},
                 {timestamp,<<"2025-11-26T18:47:35.841Z">>},
                 {doc_id,<<"<ud>hotel_16530</ud>">>},
                 {bucket_name,<<"travel-sample">>}]
Couchbase Server redacts the private data to the following:
[ns_server:debug,2025-11-26T18:47:35.841Z,ns_1@node1.example.com.:ns_audit<0.728.0>:ns_audit:handle_call:178]Audit read_doc: [{local,{[{ip,<<"172.18.0.2">>},{port,8091}]}},
                 {remote,{[{ip,<<"192.168.65.1">>},{port,26569}]}},
                 {sessionid,<<"0591ad71ffeb715b208cf7547aa5c97b47a927bb">>},
                 {real_userid,{[{domain,builtin},
                                {user,<<"<ud>74e98f5bafb73c078b6fde92f6d34497b2b87b54</ud>">>}]}},
                 {timestamp,<<"2025-11-26T18:47:35.841Z">>},
                 {doc_id,<<"<ud>845186cedd5008b3789f344b4fb8430b0015a307</ud>">>},
                 {bucket_name,<<"travel-sample">>}]
Redaction may eliminate some parameters containing non-private data as well as all parameters containing private data.
Some log files do not use the <ud> and </ud> tags to mark sensitive data.
Couchbase Server determines what information is sensitive based on the log file’s content.
Couchbase Server redacts sensitive information from these files without relying on tags.
For example, the http_access.log (stored in the zip with the filename ns_server.http_access.log) contains HTTP requests that include the username making a request as well as sensitive data in URL parameters.
The following log file fragment displays private data: the Administrator’s username and the username of a user account that the Administrator is creating:
172.18.0.2 - Administrator [26/Nov/2025:16:18:00 +0000] "PUT /settings/rbac/users/local/
             query_manage_global_functions HTTP/1.1" 200 2 - "python-requests/2.31.0" 15
Couchbase Server redacts the usernames:
172.18.0.2 - 929456b78c13ccbb87832adfef1cb1b86cbfaa8a [26/Nov/2025:16:18:00 +0000] "PUT
             /settings/rbac/users/local/8dc9486da4800ed710af4fcb86190e414593a583 HTTP/1.1" 200 2 -
             "python-requests/2.31.0" 15
Redacting log files may have these consequences:
-
Diagnosing logged issues becomes harder for both the user and Couchbase Support.
-
Collecting log data takes longer because Couchbase Server must redact the logs during collection.
Applying Redaction
You can apply redaction to collected logs using either the cbcollect_info command line tool or the Couchbase Server Web Console.
For information about redacting logs you collect using the command-line tool, see cbcollect_info.
To redact logs when collecting information using the Couchbase Web Console, select Partial Redaction under the Redact Logs section. Selecting this option displays some additional information about redaction.
When the information collection process completes, the tab shows you the location of the zip file containing the redacted log files. When you enable redaction, Couchbase Server creates 2 zip files for each node. One contains the redacted data, and the other contains unredacted data. If you chose to upload the logs to Couchbase Support, Couchbase Server uploads only the zip file containing the redacted log files.
Redact Log Files Created Outside the Cluster
Some Couchbase features, such as cbbackupmgr, the SDK, connectors, and Mobile, create log files saved outside the Couchbase cluster.
You can redact these files using the cblogredaction command-line tool.
You can supply multiple log files for it to redact in a single command line.
Each log file must be in plain text.
You can optionally generate the salt cbbackupmgr uses to generate the SHA-1 hashes of sensitive information automatically.
For example:
$ cblogredaction /Users/username/testlog.log -g -o /Users/username -vv
2018/07/17T11:27:06 WARNING: Automatically generating salt. This will make it difficult to cross reference logs
2018/07/17T11:27:07 DEBUG: /Users/username/testlog.log - Starting redaction file size is 19034284 bytes
2018/07/17T11:27:07 DEBUG: /Users/username/testlog.log - Log redacted using salt: <ud>COeAtexHB69hGEf3</ud>
2018/07/17T11:27:07 INFO: /Users/username/testlog.log - Finished redacting, 50373 lines processed, 740 tags redacted, 0 lines with unmatched tags
For more Information about this tool, see cblogredaction.
Uploading Log Files
You can upload collected log files to Couchbase for inspection by Couchbase Support. To learn how to upload using the command line, see cbcollect_info.
To upload using Couchbase Web Console, click Upload to Couchbase before starting the collection process. When you do, several new fields appear in the dialog:
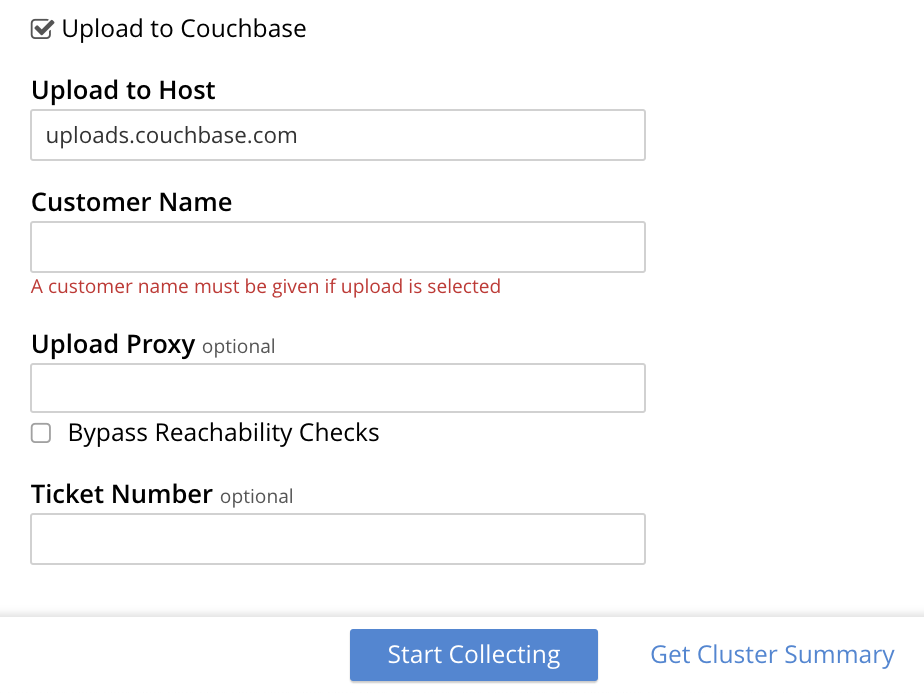
Upload to Host sets the host to which Couchbase Server uploads your log files.
You must provide your Customer Name and optionally a Ticket Number.
Use the optional Upload Proxy field to set the proxy host and port number if your cluster cannot directly connect to the upload host.
Its format is the same as the curl command’s -x option.
You usually supply a URL such as http://proxy.example.com:8080, although you can provide just a hostname or IP address with a port number.
If you select Bypass Reachability Checks, Couchbase Server does not verify that it can connect to the upload host and, if provided, the proxy before collecting and uploading logs. It’s cleared by default, which has Couchbase Server verify its ability to connect to the upload destination before collecting logs.
After entering all required information, click Start Collecting to start information collection. If the collection and upload succeed, the page displays the URL of the uploaded zip file.
Receiving Upload Receipts from Couchbase Customer Support
Couchbase Server Enterprise
Couchbase Customer Support can send you an automatic notification when they receive any log file uploaded for a support case. This function is opt-in. Contact your account manager or Couchbase Support for more information.
When a Couchbase Support Engineer requests logs from a customer with this feature enabled, the request includes a unique upload URL and UUID for the support case:
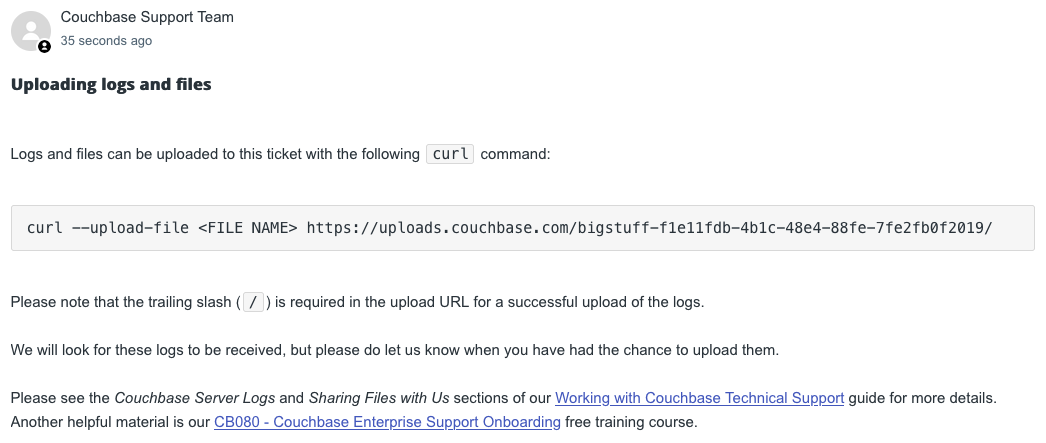
You can use curl to upload the log file using the provided URL and UUID:
curl --upload-file [filename] https://uploads.couchbase.com/bigstuff-fle11fdb-4b1c-48e4-88fe-7fe2fb0f2019/
Include the final forward slash (/) character at the end of the command.
|
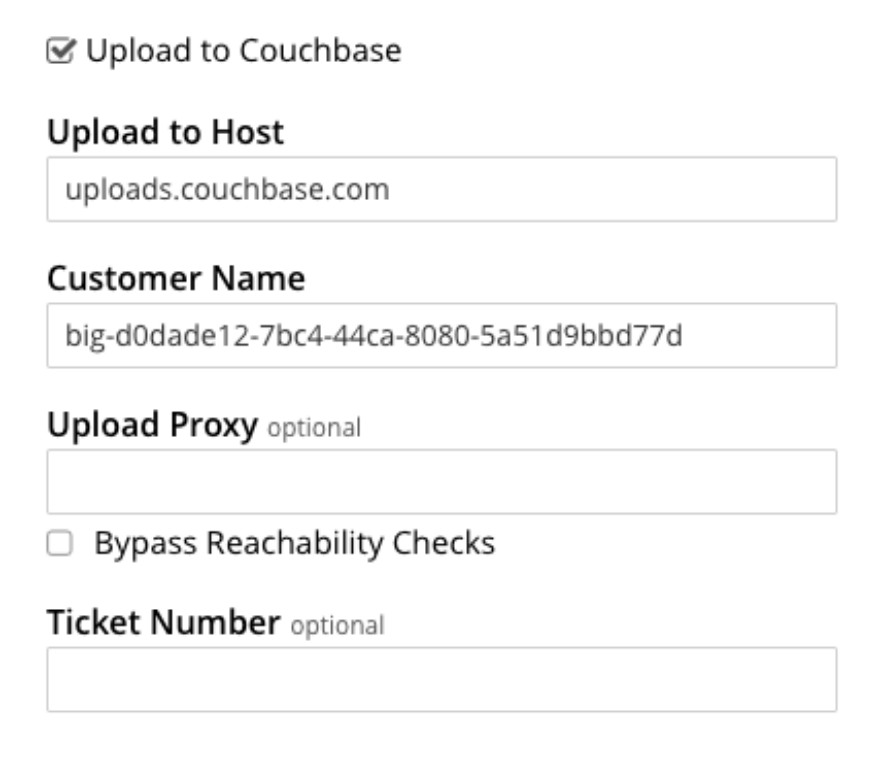
You can also send the file using the Couchbase Server web console:
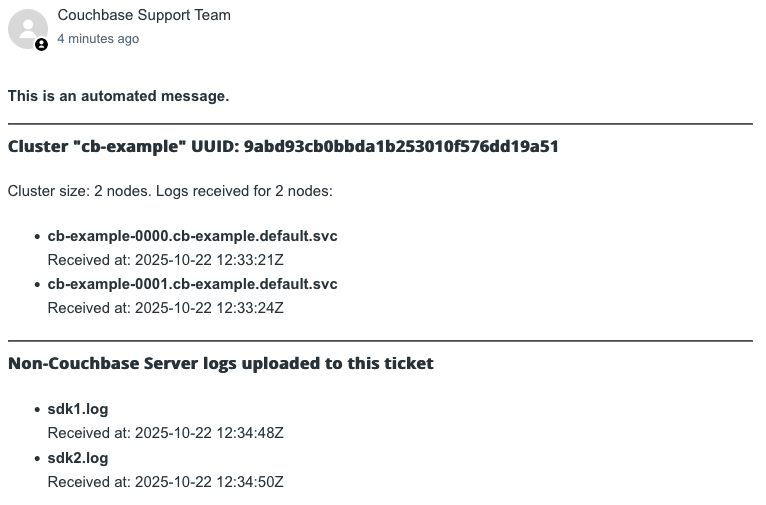
After you upload the log files, you receive an acknowledgement attached to your support ticket:
Adjusting Threshold for Logging Slow Operations
You can examine and alter the logging threshold for slow-running operations.
Use the mcctl command packaged with the Couchbase Server installation.
The command only gets or sets information for the node where you run it.
Getting Threshold Details
Retrieve the current settings using the mcctl CLI to execute the get sla command:
|
These settings only apply to the nodes where you make the changes. You must implement the changes on each node to apply them across the cluster. You must also configure the node to run the |
/opt/couchbase/bin/mcctl --host localhost -u Administrator -P password \
get sla{"comment":"Current MCBP SLA configuration",
"version":1,
"default":{"slow":"500 ms"}},
"COMPACT_DB":{"slow":"1800 s"},
"DELETE_BUCKET":{"slow":"10 s"},
"SEQNO_PERSISTENCE":{"slow":"30 s"}
}The JSON message gives details about the operation being logged and the threshold time that causes a timing message to be logged.
Setting the Threshold
Use the mcctl command line interface to set thresholds for Memcached operations:
/opt/couchbase/bin/mcctl --host localhost -u Administrator -P password \
set sla '{"version":1, "DELETE_BUCKET":{"slow":"100 ms"}}'
In this example, the threshold for the DELETE_BUCKET operation is set to 100 ms.
If a bucket deletion operation takes longer than this, a message is logged.
|
You can also specify the time interval without a space: |
You can set the threshold for all op-codes in a single command using the default code:
/opt/couchbase/bin/mcctl --host localhost -u Administrator -P password \
set sla '{"version":1, "default":{"slow":"100 ms"}}'Setting threshold values is non-persistent. When the node restarts, thresholds reset to their default values.
Setting Threshold Defaults
The default values load from the file /opt/couchbase/etc/couchbase/kv/opcode-attributes.json when the node starts.
{
  "comment": "Default configuration file. Do not edit, but override the settings in opcode-attributes.d/",
  "version": 1,
  "default": {
    "slow": "500 ms"
  },
  "compact_db": {
    "slow": "30 m"
  },
  "create_bucket": {
    "slow": "70 ms"
  },
  "select_bucket": {
    "slow": "10 ms"
  },
  "delete_bucket": {
    "slow": "10 s"
  },
  "seqno_persistence": {
    "slow": "30 s"
  }
}
You can override these values by creating another file in the /opt/couchbase/etc/couchbase/kv/opcode-attributes.d directory.
Copy the existing settings file into the directory, making sure there is no existing file in the directory:
cd /opt/couchbase/etc/couchbase/kv/

cp opcode-attributes.json opcode-attributes.d
Edit /opt/couchbase/etc/couchbase/kv/opcode-attributes.d/opcode-attributes.json with the new settings.
| These settings only apply to the node where you make the changes. To change the threshold across the cluster, apply all configurations to each node. |