Couchbase Server provides a UI to monitor the current state of Query Service.
| Query Monitoring is only available in Enterprise Edition. |
To display the Query Monitor, in the Couchbase Web Console, choose .
In the Query Monitor, you can view the different types queries that are Active (currently running), Completed (recently run), and Prepared (aggregate statistics for prepared queries). Statistics information for the query service is displayed at the bottom of the page. Different information may be shown, depending on your access control role.
The information about these queries is automatically updated every 5 seconds. To freeze the display updates, click pause located above the query table, next to the table heading. When paused, a resume button becomes available to let you restart automatic updates. You can sort the query information table by clicking on any of the column headers.
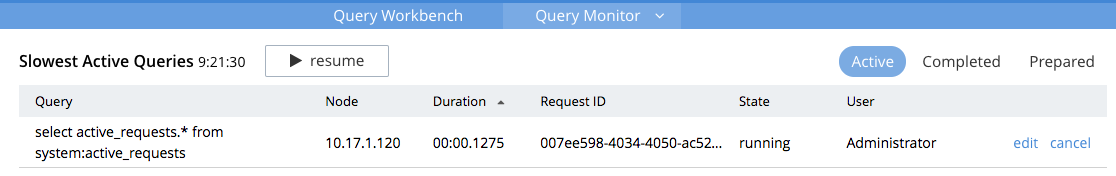
Active Queries
By default, the Active Queries page is displayed on the Query Monitor. The currently running queries are displayed, showing the details such as the query syntax, the query node address where the query is running, duration, request identification number, and the current state of the query. Click the edit link to edit that particular query in the Query Workbench. To cancel a long running query, click the cancel link located on the right side of the row.
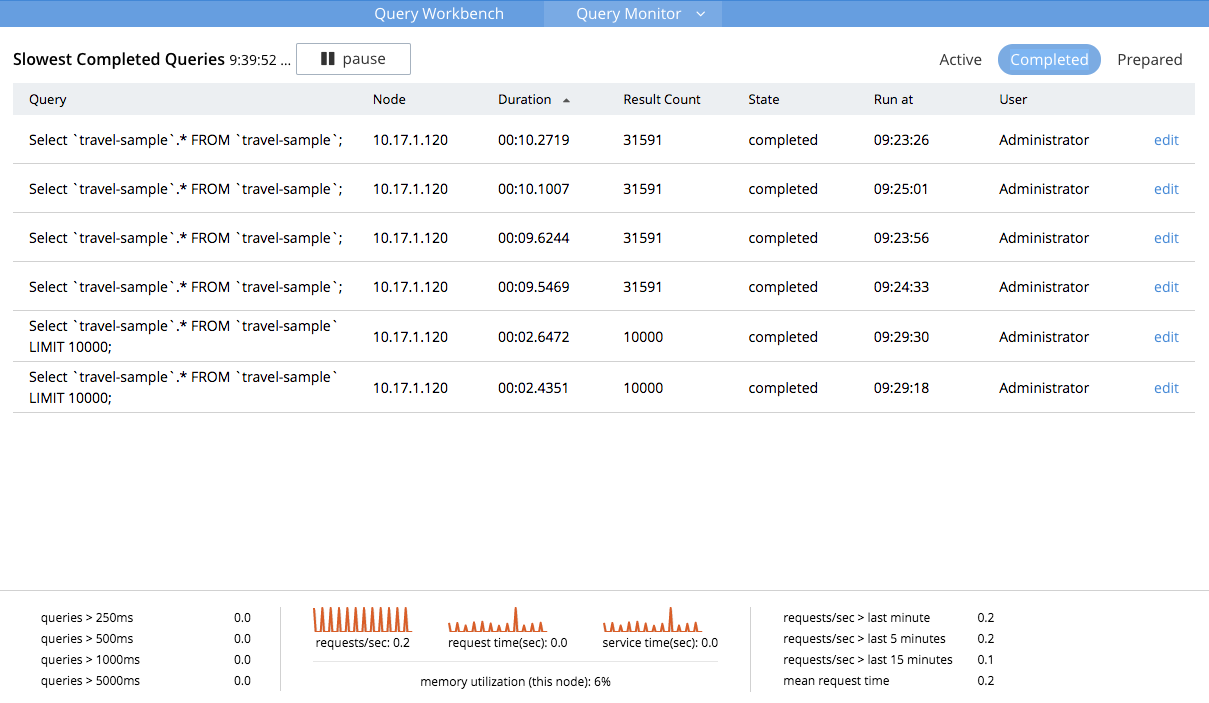
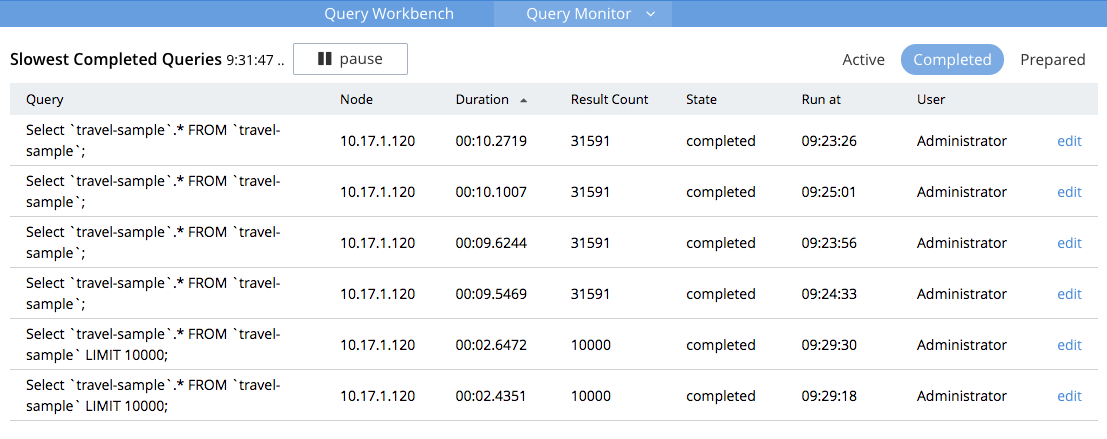
Completed Queries
In the Query Monitor, click the Completed button to view the table of completed queries whose runtime exceeded a system-specified threshold (default 1 second). Each row shows the query syntax, the query node address where the query was run, duration, the result count, the final state of the query (for example, completed, cancelled), and the timestamp when the query was run.
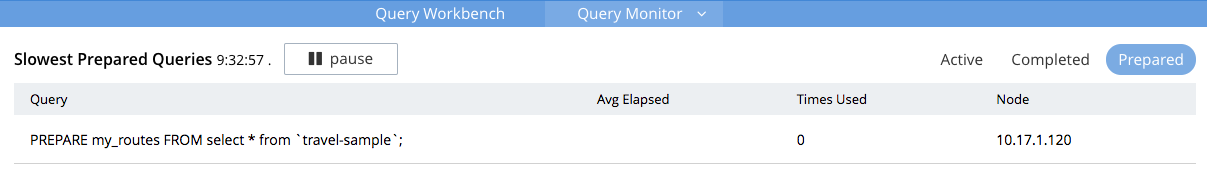
Prepared Queries
In the Query Monitor, click the Prepared button to view the prepared queries. This page displays the aggregate statistics for prepared queries showing details such as query syntax, average elapsed time, number of uses, and the query node address.
For more information about system keyspaces and API for monitoring the operation of individual queries and query service nodes, see Manage and Monitor Queries.